Tutorial for Visium DLPFC dataset
Need additional packages: scanpy seaborn networkx
Load the packages
[ ]:
%reload_ext autoreload
%autoreload 2

import os
import time
import scanpy as sc
import pandas as pd
import numpy as np
import anndata as ad
import seaborn as sns
import matplotlib.pyplot as plt
import matplotlib.patches as mpatches

from sklearn.metrics import adjusted_rand_score, adjusted_mutual_info_score, f1_score

from Harmonics import *

import warnings
warnings.filterwarnings("ignore")

sc.settings.verbosity = 0
sc.settings.set_figure_params(dpi=50, dpi_save=500)

from matplotlib import rcParams
rcParams["figure.dpi"] = 50
rcParams["savefig.dpi"] = 500
rcParams['pdf.fonttype'] = 42
rcParams['svg.fonttype'] = 'none'
rcParams['ps.fonttype'] = 42
# rcParams['font.family'] = 'Arial'
rcParams['savefig.transparent'] = True
[1891]:
read_dir = f'../../results/Visium_DLPFC_Maynard2021/STitch3D/'
save_dir = f'../../results/Visium_DLPFC_Maynard2021/Harmonics/'
if not os.path.exists(save_dir):
    os.makedirs(save_dir)
Define a function to match the niche label to ground truth annotation and a function to change p values to corresponding star representation, used to show the results of additional tests implemented in Harmonics.
[1892]:
import numpy as np
import pandas as pd
import networkx as nx

def match_cluster_labels(true_labels, est_labels):
    true_labels_arr = np.array(list(true_labels))
    est_labels_arr = np.array(list(est_labels))

    org_cat = list(np.sort(list(pd.unique(true_labels))))
    est_cat = list(np.sort(list(pd.unique(est_labels))))

    B = nx.Graph()
    B.add_nodes_from([i + 1 for i in range(len(org_cat))], bipartite=0)
    B.add_nodes_from([-j - 1 for j in range(len(est_cat))], bipartite=1)

    for i in range(len(org_cat)):
        for j in range(len(est_cat)):
            weight = np.sum((true_labels_arr == org_cat[i]) * (est_labels_arr == est_cat[j]))
            B.add_edge(i + 1, -j - 1, weight=-weight)

    match = nx.algorithms.bipartite.matching.minimum_weight_full_matching(B)

    if len(org_cat) >= len(est_cat):
        return np.array([match[-est_cat.index(c) - 1] - 1 for c in est_labels_arr])
    else:
        unmatched = [c for c in est_cat if not (-est_cat.index(c) - 1) in match.keys()]
        l = []
        for c in est_labels_arr:
            if (-est_cat.index(c) - 1) in match:
                l.append(match[-est_cat.index(c) - 1] - 1)
            else:
                l.append(len(org_cat) + unmatched.index(c))
        return np.array(l)


def p2stars(p):
    if p < 0.001:
        return '***'
    elif p < 0.01:
        return '**'
    elif p < 0.05:
        return '*'
    else:
        return ''
Load dataset
This dataset includes three groups, each containing 4 slices.
Set g to “g1”, “g2”, “g3” to load data from an individual group.
Spots with no applicable annotation are removed
[1893]:
g = 'g2'
groups = {'g1': ['151507', '151508', '151509', '151510'],
          'g2': ['151669', '151670', '151671', '151672'],
          'g3': ['151673', '151674', '151675', '151676']}
slice_name_list = groups[g]

celltype_list_use = ['Astros_1', 'Astros_2', 'Astros_3',
                     'Endo',
                     'Ex_10_L2_4', 'Ex_1_L5_6', 'Ex_2_L5', 'Ex_3_L4_5', 'Ex_4_L_6', 'Ex_5_L5',
                     'Ex_6_L4_6', 'Ex_7_L4_6', 'Ex_8_L5_6', 'Ex_9_L5_6',
                     'Micro/Macro',
                     'Oligos_1', 'Oligos_2', 'Oligos_3',
                     ]
celltype_list_use = sorted(celltype_list_use)

adata_list = []
for slice_name in slice_name_list:
    adata = ad.read_h5ad(read_dir + f'{slice_name}_STitch3D.h5ad')
    adata = adata[adata.obs['Manual_Annotation'].notna(), :].copy()

    # place the cell type deconvolution result in .obsm['ct_prop']
    ct_prop = adata.obs[celltype_list_use].to_numpy()
    # row_sums = ct_prop.sum(axis=1, keepdims=True)
    # ct_prop = ct_prop / row_sums
    adata.obsm['ct_prop'] = sp.csr_matrix(ct_prop)
    print(adata)

    adata_list.append(adata)
AnnData object with n_obs × n_vars = 3636 × 21216
    obs: 'in_tissue', 'x', 'y', 'image_row', 'image_col', 'imagerow', 'imagecol', 'Manual_Annotation', 'array_row', 'array_col', 'Astros_1', 'Astros_2', 'Astros_3', 'Endo', 'Ex_10_L2_4', 'Ex_1_L5_6', 'Ex_2_L5', 'Ex_3_L4_5', 'Ex_4_L_6', 'Ex_5_L5', 'Ex_6_L4_6', 'Ex_7_L4_6', 'Ex_8_L5_6', 'Ex_9_L5_6', 'Micro/Macro', 'Oligos_1', 'Oligos_2', 'Oligos_3'
    var: 'gene_ids', 'feature_types', 'genome', 'MT_gene', 'n_counts'
    obsm: 'latent', 'radius', 'spatial', 'spatial_aligned', 'spatial_img', 'ct_prop'
AnnData object with n_obs × n_vars = 3484 × 20999
    obs: 'in_tissue', 'x', 'y', 'image_row', 'image_col', 'imagerow', 'imagecol', 'Manual_Annotation', 'array_row', 'array_col', 'Astros_1', 'Astros_2', 'Astros_3', 'Endo', 'Ex_10_L2_4', 'Ex_1_L5_6', 'Ex_2_L5', 'Ex_3_L4_5', 'Ex_4_L_6', 'Ex_5_L5', 'Ex_6_L4_6', 'Ex_7_L4_6', 'Ex_8_L5_6', 'Ex_9_L5_6', 'Micro/Macro', 'Oligos_1', 'Oligos_2', 'Oligos_3'
    var: 'gene_ids', 'feature_types', 'genome', 'MT_gene', 'n_counts'
    obsm: 'latent', 'radius', 'spatial', 'spatial_aligned', 'spatial_img', 'ct_prop'
AnnData object with n_obs × n_vars = 4093 × 21610
    obs: 'in_tissue', 'x', 'y', 'image_row', 'image_col', 'imagerow', 'imagecol', 'Manual_Annotation', 'array_row', 'array_col', 'Astros_1', 'Astros_2', 'Astros_3', 'Endo', 'Ex_10_L2_4', 'Ex_1_L5_6', 'Ex_2_L5', 'Ex_3_L4_5', 'Ex_4_L_6', 'Ex_5_L5', 'Ex_6_L4_6', 'Ex_7_L4_6', 'Ex_8_L5_6', 'Ex_9_L5_6', 'Micro/Macro', 'Oligos_1', 'Oligos_2', 'Oligos_3'
    var: 'gene_ids', 'feature_types', 'genome', 'MT_gene', 'n_counts'
    obsm: 'latent', 'radius', 'spatial', 'spatial_aligned', 'spatial_img', 'ct_prop'
AnnData object with n_obs × n_vars = 3888 × 21283
    obs: 'in_tissue', 'x', 'y', 'image_row', 'image_col', 'imagerow', 'imagecol', 'Manual_Annotation', 'array_row', 'array_col', 'Astros_1', 'Astros_2', 'Astros_3', 'Endo', 'Ex_10_L2_4', 'Ex_1_L5_6', 'Ex_2_L5', 'Ex_3_L4_5', 'Ex_4_L_6', 'Ex_5_L5', 'Ex_6_L4_6', 'Ex_7_L4_6', 'Ex_8_L5_6', 'Ex_9_L5_6', 'Micro/Macro', 'Oligos_1', 'Oligos_2', 'Oligos_3'
    var: 'gene_ids', 'feature_types', 'genome', 'MT_gene', 'n_counts'
    obsm: 'latent', 'radius', 'spatial', 'spatial_aligned', 'spatial_img', 'ct_prop'
Run model
Instantiate Harmonics
Since the cell type deconvolution results may not have the same quality as cell type annotation of the data with single cell resolution. We perform distribution refinement by focusing on the top k enriched celltypes for individual groups.
For g1, g2, and g3, we set k=10, k=5, and k=10, respectively.
[1894]:
refine_k_dict = {'g1': 10, 'g2': 5, 'g3': 10}
model = Harmonics_Model(adata_list,
                        slice_name_list,
                        cond_list=None,  # default
                        cond_name_list=None,  # default
                        concat_label='slice_name',  # default
                        proportion_label='ct_prop',
                        refine_k=refine_k_dict[g],
                        seed=1234,  # default
                        parallel=True,  # default
                        verbose=True,  # default
                        )
Dataset comprises 4 slices, 15101 cells/spots in total.
Preprocess the data (Generating the connection graph and calculating neighborhood average cell type proportion for cells).
[1895]:
model.preprocess(ct_key=None,  # use celltype deconvolution result, do not need celltype
                 spatial_key='spatial',  # default
                 method='joint',  # default
                 n_step=3,
                 n_neighbors=20,  # default
                 cut_percentage=99,  # default
                 )
Generating Delaunay neighbor graph...
100%|██████████| 4/4 [00:00<00:00, 29.51it/s]
All done!

Performing graph completion...
100%|██████████| 4/4 [00:00<00:00, 4.49it/s]
All done!

Dataset comprises 18 cell types.

Calculating cell type distribution for microenvironments...
Microenvironments comprise 40.08 cells/spots on average.
Minimum: 20, Maximum: 50
Perform overclustered initialization on the cell type distributions of cell neighborhoods. Resulting in Qmax niches. The distributions of niches are also computed.
[1896]:
model.initialize_clusters(dim_reduction=True,  # default
                          explained_var=None,  # default
                          n_components=None,  # default
                          n_components_max=100,  # default
                          standardize=True,  # default
                          method='kmeans',  # default
                          Qmax=20,  # default
                          )
Performing dimension reduction...
Returning 18 principal components.

Initializing niches...
20 initial niches defined.
Perform hierarchical distribution matching to reduce the niche number to no less than Qmin. This step results in niche assignment under a sequence of different niche numbers (usually from Qmax to Qmin).
[ ]:
model.hier_dist_match(assign_metric='jsd',  # default
                      weighted_merge=True,  # default
                      max_iters=100,  # default
                      tol=1e-4,  # default
                      test_kmeans=False,  # default
                      Qmin=2,  # default
                      )
Starting from 20 cell niches...

Assigning cells to cell niche...
Current state: [0, 1, 2, 3, 4, 5, 6, 7, 8, 9, 10, 11, 12, 13, 14, 15, 16, 17, 18, 19]
19%|█▉ | 19/100 [00:00<00:01, 49.35it/s]
Distribution of cell niches (centers) converge at iteration 20.
20 cell niches left.
Merging cell niche 15 and cell niche 4...
Done!

Assigning cells to cell niche...
Current state: [0, 1, 2, 3, 5, 6, 7, 8, 9, 10, 11, 12, 13, 14, 15, 16, 17, 18, 19]
3%|▎ | 3/100 [00:00<00:02, 38.21it/s]
Distribution of cell niches (centers) converge at iteration 4.
19 cell niches left.
Merging cell niche 17 and cell niche 8...
Done!

Assigning cells to cell niche...
Current state: [0, 1, 2, 3, 5, 6, 7, 9, 10, 11, 12, 13, 14, 15, 16, 17, 18, 19]
0%| | 0/100 [00:00<?, ?it/s]
Distribution of cell niches (centers) converge at iteration 4.
3%|▎ | 3/100 [00:00<00:02, 35.75it/s]
18 cell niches left.
Merging cell niche 17 and cell niche 16...
Done!

Assigning cells to cell niche...
Current state: [0, 1, 2, 3, 5, 6, 7, 9, 10, 11, 12, 13, 14, 15, 17, 18, 19]
3%|▎ | 3/100 [00:00<00:02, 35.03it/s]
Distribution of cell niches (centers) converge at iteration 4.
17 cell niches left.
Merging cell niche 17 and cell niche 13...
Done!

Assigning cells to cell niche...
Current state: [0, 1, 2, 3, 5, 6, 7, 9, 10, 11, 12, 14, 15, 17, 18, 19]
0%| | 0/100 [00:00<?, ?it/s]
Distribution of cell niches (centers) converge at iteration 5.
4%|▍ | 4/100 [00:00<00:02, 45.71it/s]
16 cell niches left.
Merging cell niche 12 and cell niche 17...
Done!

Assigning cells to cell niche...
Current state: [0, 1, 2, 3, 5, 6, 7, 9, 10, 11, 12, 14, 15, 18, 19]
2%|▏ | 2/100 [00:00<00:02, 36.03it/s]
Strictly converge at iteration 3.
15 cell niches left.
Merging cell niche 12 and cell niche 1...
Done!

Assigning cells to cell niche...
Current state: [0, 2, 3, 5, 6, 7, 9, 10, 11, 12, 14, 15, 18, 19]
0%| | 0/100 [00:00<?, ?it/s]
Distribution of cell niches (centers) converge at iteration 1.
14 cell niches left.
Merging cell niche 19 and cell niche 15...
Done!

Assigning cells to cell niche...
Current state: [0, 2, 3, 5, 6, 7, 9, 10, 11, 12, 14, 18, 19]
3%|▎ | 3/100 [00:00<00:02, 35.92it/s]
Distribution of cell niches (centers) converge at iteration 4.
13 cell niches left.
Merging cell niche 7 and cell niche 2...
Done!

Assigning cells to cell niche...
Current state: [0, 3, 5, 6, 7, 9, 10, 11, 12, 14, 18, 19]
0%| | 0/100 [00:00<?, ?it/s]
Distribution of cell niches (centers) converge at iteration 5.
4%|▍ | 4/100 [00:00<00:01, 49.08it/s]
12 cell niches left.
Merging cell niche 3 and cell niche 12...
Done!

Assigning cells to cell niche...
Current state: [0, 3, 5, 6, 7, 9, 10, 11, 14, 18, 19]
6%|▌ | 6/100 [00:00<00:01, 51.46it/s]
Strictly converge at iteration 7.
11 cell niches left.
Merging cell niche 7 and cell niche 14...
Done!

Assigning cells to cell niche...
Current state: [0, 3, 5, 6, 7, 9, 10, 11, 18, 19]
7%|▋ | 7/100 [00:00<00:01, 53.26it/s]
Distribution of cell niches (centers) converge at iteration 8.
10 cell niches left.
Merging cell niche 9 and cell niche 3...
Done!

Assigning cells to cell niche...
Current state: [0, 5, 6, 7, 9, 10, 11, 18, 19]
4%|▍ | 4/100 [00:00<00:01, 52.40it/s]
Distribution of cell niches (centers) converge at iteration 5.
9 cell niches left.
Merging cell niche 19 and cell niche 9...
Done!

Assigning cells to cell niche...
Current state: [0, 5, 6, 7, 10, 11, 18, 19]
5%|▌ | 5/100 [00:00<00:02, 47.31it/s]
Distribution of cell niches (centers) converge at iteration 6.
8 cell niches left.
Merging cell niche 11 and cell niche 10...
Done!

Assigning cells to cell niche...
Current state: [0, 5, 6, 7, 11, 18, 19]
6%|▌ | 6/100 [00:00<00:01, 49.79it/s]
Distribution of cell niches (centers) converge at iteration 7.
7 cell niches left.
Merging cell niche 19 and cell niche 6...
Done!

Assigning cells to cell niche...
Current state: [0, 5, 7, 11, 18, 19]
5%|▌ | 5/100 [00:00<00:01, 54.10it/s]
Distribution of cell niches (centers) converge at iteration 6.
6 cell niches left.
Merging cell niche 19 and cell niche 0...
Done!

Assigning cells to cell niche...
Current state: [5, 7, 11, 18, 19]
5%|▌ | 5/100 [00:00<00:01, 52.50it/s]
Distribution of cell niches (centers) converge at iteration 6.
5 cell niches left.
Merging cell niche 11 and cell niche 5...
Done!

Assigning cells to cell niche...
Current state: [7, 11, 18, 19]
0%| | 0/100 [00:00<?, ?it/s]
Distribution of cell niches (centers) converge at iteration 4.
3%|▎ | 3/100 [00:00<00:02, 47.62it/s]
4 cell niches left.
Merging cell niche 18 and cell niche 19...
Done!

Assigning cells to cell niche...
Current state: [7, 11, 18]
3%|▎ | 3/100 [00:00<00:02, 47.99it/s]
Distribution of cell niches (centers) converge at iteration 4.
3 cell niches left.
Merging cell niche 7 and cell niche 11...
Done!

Assigning cells to cell niche...
Current state: [7, 18]
3%|▎ | 3/100 [00:00<00:02, 46.50it/s]
Distribution of cell niches (centers) converge at iteration 4.
2 cell niches left.
Niche count no more than 2.

Finished!
Select the solution by seting the n_niche to 5 for g2 and 7 for other groups to match the number of niches from expert annotations. The results of niche assignments are saved in .obs[niche_key]
[1898]:
if g == 'g2':
    n_cluster = 5
else:
    n_cluster = 7
adata_list, adata_concat = model.select_solution(n_niche=n_cluster,
                                                 niche_key='niche_label',  # default
                                                 auto=False,
                                                 metric='jsd_v2',  # default
                                                 threshold=0.1,  # default
                                                 return_adata=True,  # default
                                                 plot=True,  # default
                                                 save=False,  # default
                                                 fig_size=(10, 6),  # default
                                                 save_dir=save_dir,
                                                 file_name=f'score_vs_nichecount_basic_{g}.pdf',
                                                 )
Selecting solution based on specified niche count...
Done!
Save and reload the results
[ ]:
adata_concat.write_h5ad(save_dir + f'Harmonics_result_{g}_0.h5ad')
[ ]:
adata_concat = ad.read_h5ad(save_dir + f'Harmonics_result_{g}_0.h5ad')
adata_concat_new = adata_concat.copy()
adata_concat_new
AnnData object with n_obs × n_vars = 15101 × 19177
    obs: 'in_tissue', 'x', 'y', 'image_row', 'image_col', 'imagerow', 'imagecol', 'Manual_Annotation', 'array_row', 'array_col', 'Astros_1', 'Astros_2', 'Astros_3', 'Endo', 'Ex_10_L2_4', 'Ex_1_L5_6', 'Ex_2_L5', 'Ex_3_L4_5', 'Ex_4_L_6', 'Ex_5_L5', 'Ex_6_L4_6', 'Ex_7_L4_6', 'Ex_8_L5_6', 'Ex_9_L5_6', 'Micro/Macro', 'Oligos_1', 'Oligos_2', 'Oligos_3', 'slice_name', 'n_neighbors', 'niche_label'
    uns: 'niche_cell_count', 'niche_dist', 'niche_label_summary'
    obsm: 'ct_prop', 'latent', 'micro_dist', 'proportion', 'radius', 'spatial', 'spatial_aligned', 'spatial_img'
[1901]:
domains = ['Layer1', 'Layer2', 'Layer3', 'Layer4', 'Layer5', 'Layer6', 'WM']
domain_color_dict = {f'{domains[i]}': sns.color_palette()[i] for i in range(len(domains))}

niche_color_dict = {str(k): sns.color_palette()[k] for k in range(len(domains))}

ct_colors = sns.color_palette('tab20', len(celltype_list_use))
ct_color_dict = {celltype_list_use[k]: ct_colors[k] for k in range(len(celltype_list_use))}
[1902]:
# latent = adata_concat_new.obsm['latent'].copy()
# gmm = GaussianMixture(n_components=n_cluster, random_state=1234)
# gmm.fit(latent)
# adata_concat_new.obs['niche_label_STitch3D'] = gmm.predict(latent)
# adata_concat_new.obs['niche_label_STitch3D'] = adata_concat_new.obs['niche_label_STitch3D'].astype(str)
Match the niche assignment label to the experts annotations
[1903]:
if g == 'g2':
    matched_clusters = match_cluster_labels(adata_concat_new.obs['Manual_Annotation'], adata_concat_new.obs[f'niche_label']) + 2
else:
    matched_clusters = match_cluster_labels(adata_concat_new.obs['Manual_Annotation'], adata_concat_new.obs[f'niche_label'])
matched_labels = [domains[idx] if idx < len(domains) else 'Unmatched' for idx in matched_clusters]
adata_concat_new.obs[f'matched_cluster'] = [str(label) for label in matched_clusters]
adata_concat_new.obs[f'matched_label'] = matched_labels

start = 0
for i in range(len(adata_list)):
    end = start + adata_list[i].shape[0]
    adata = adata_concat_new[start:end].copy()
    adata_list[i].obs['matched_cluster'] = adata_concat_new[start:end].obs['matched_cluster'].copy()
    adata_list[i].obs['matched_label'] = adata_concat_new[start:end].obs['matched_label'].copy()
    adata_list[i].obs['niche_label'] = adata_concat_new[start:end].obs['niche_label'].copy()
    start = end
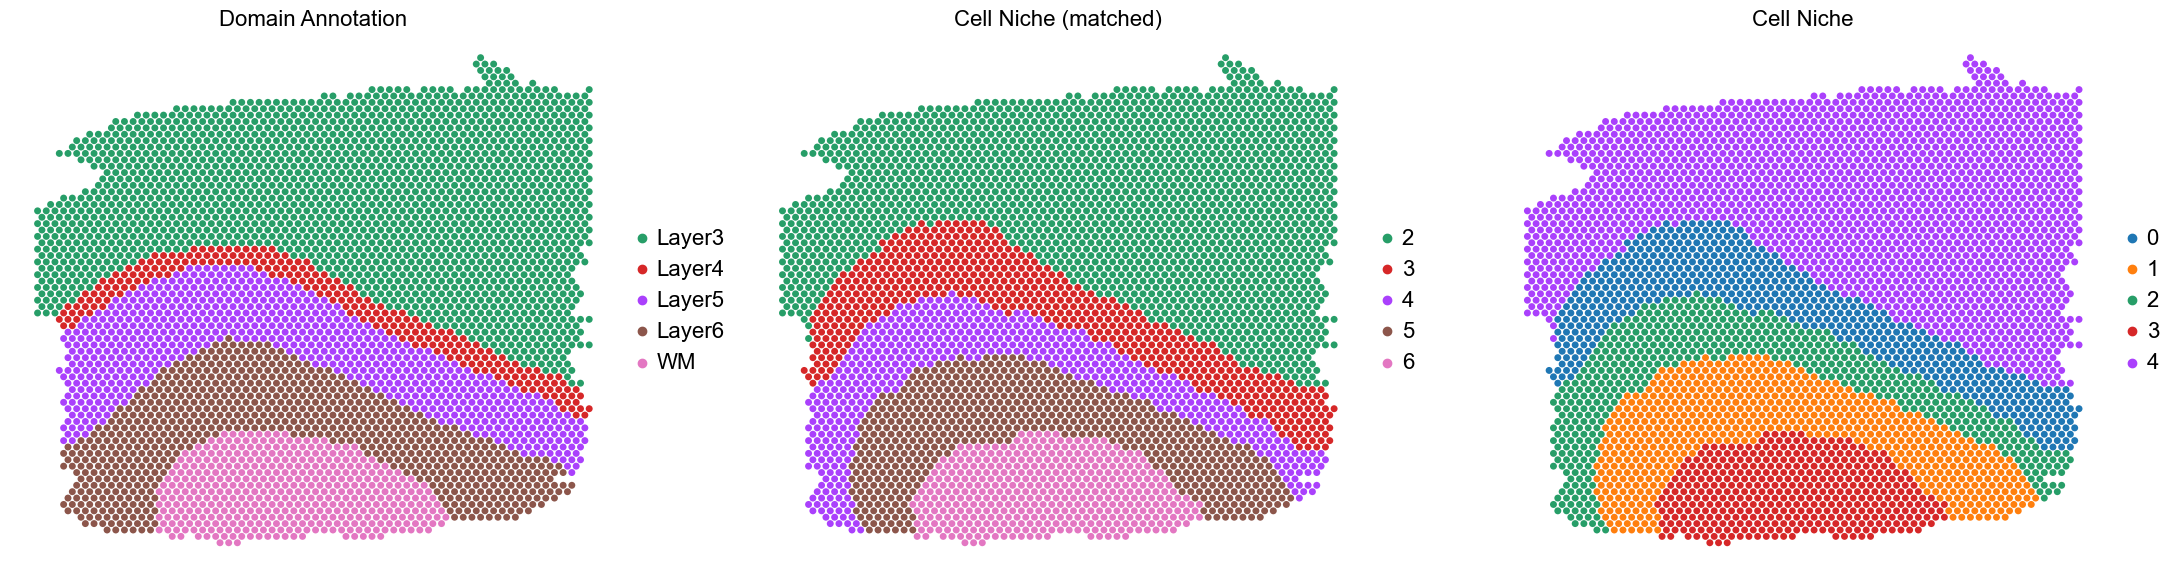
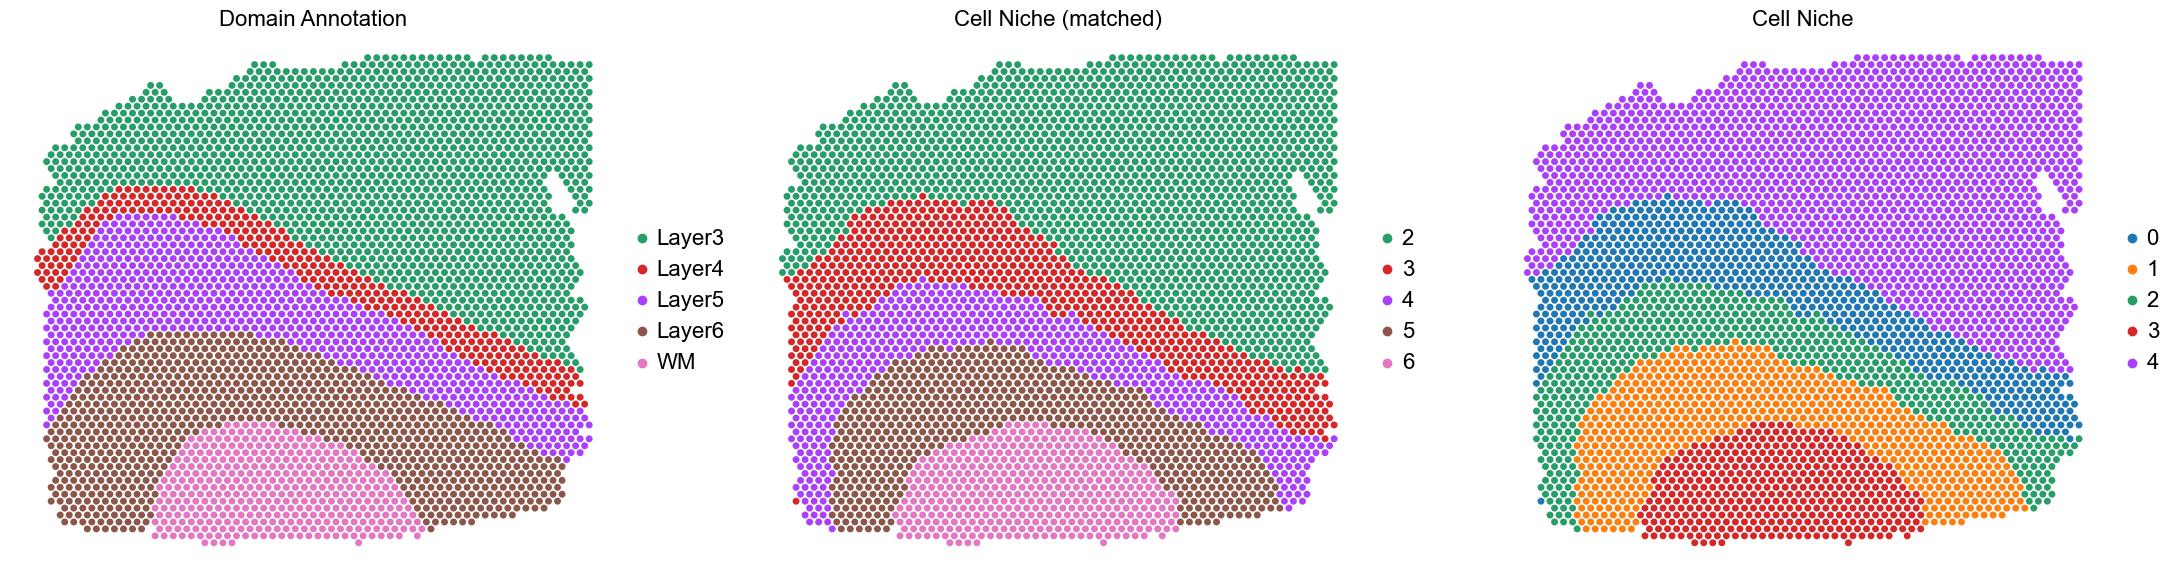
Plot and calculate the scores for each slice.
[1904]:
ari_scores = []
ami_scores = []
mf1_scores = []
wf1_scores = []
for i in range(len(slice_name_list)):
print(slice_name_list[i])
adata = adata_list[i].copy()
ari = adjusted_rand_score(adata.obs['Manual_Annotation'], adata.obs['matched_cluster'])
ami = adjusted_mutual_info_score(adata.obs['Manual_Annotation'], adata.obs['matched_cluster'])
f1_macro = f1_score(adata.obs['Manual_Annotation'], adata.obs['matched_label'], average='macro')
f1_weighted = f1_score(adata.obs['Manual_Annotation'], adata.obs['matched_label'], average='weighted')
print(f"ARI: {ari: .4f}, AMI: {ami: .4f}, mF1: {f1_macro: .4f}, wF1: {f1_weighted: .4f}")
ari_scores.append(ari)
ami_scores.append(ami)
mf1_scores.append(f1_macro)
wf1_scores.append(f1_weighted)
print(f'ARI:{ari: .4f} AMI:{ami: .4f} mF1:{f1_macro: .4f} wF1:{f1_weighted: .4f}')
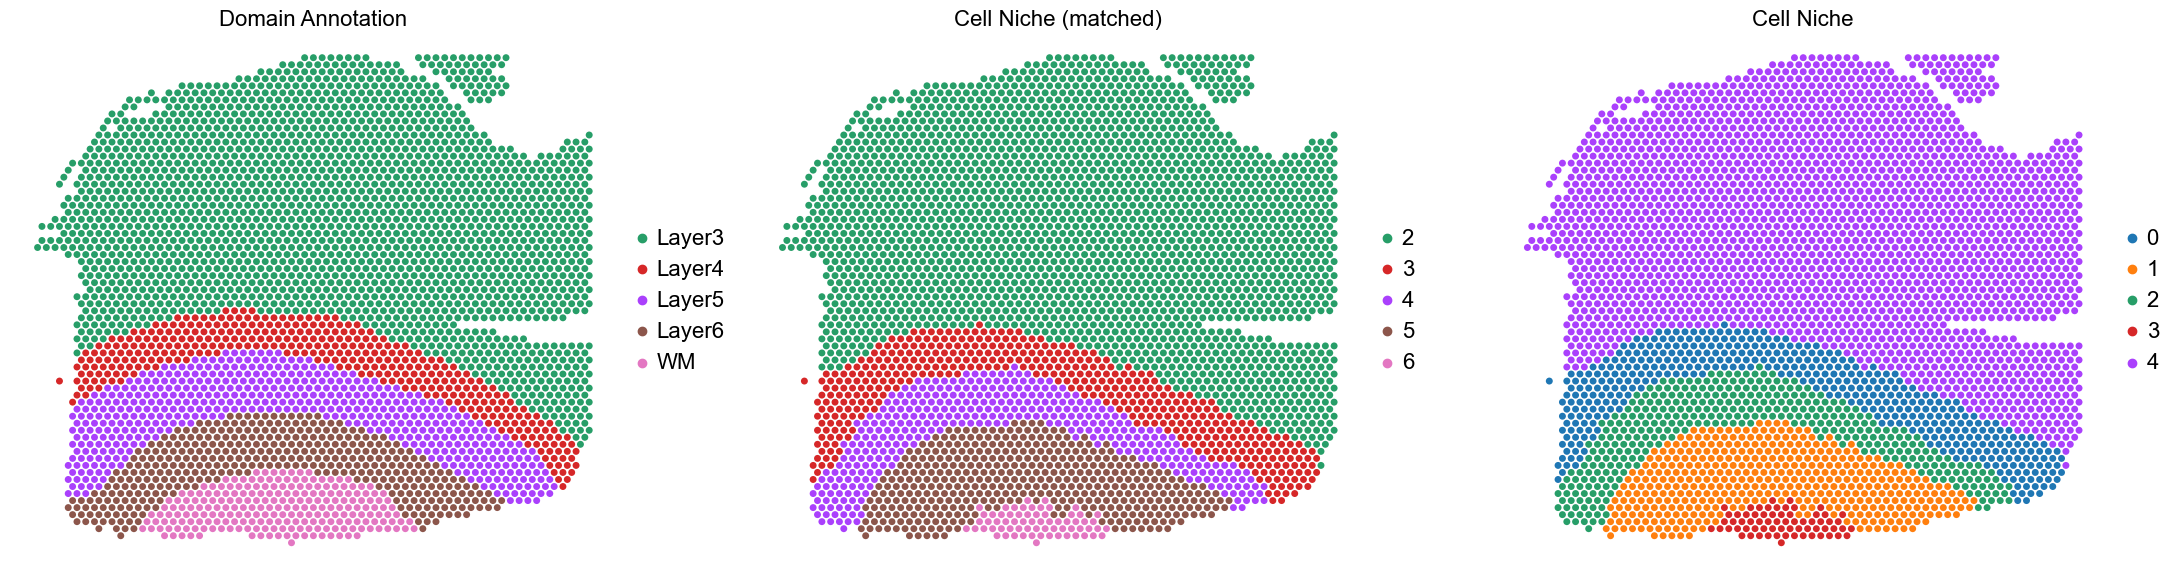
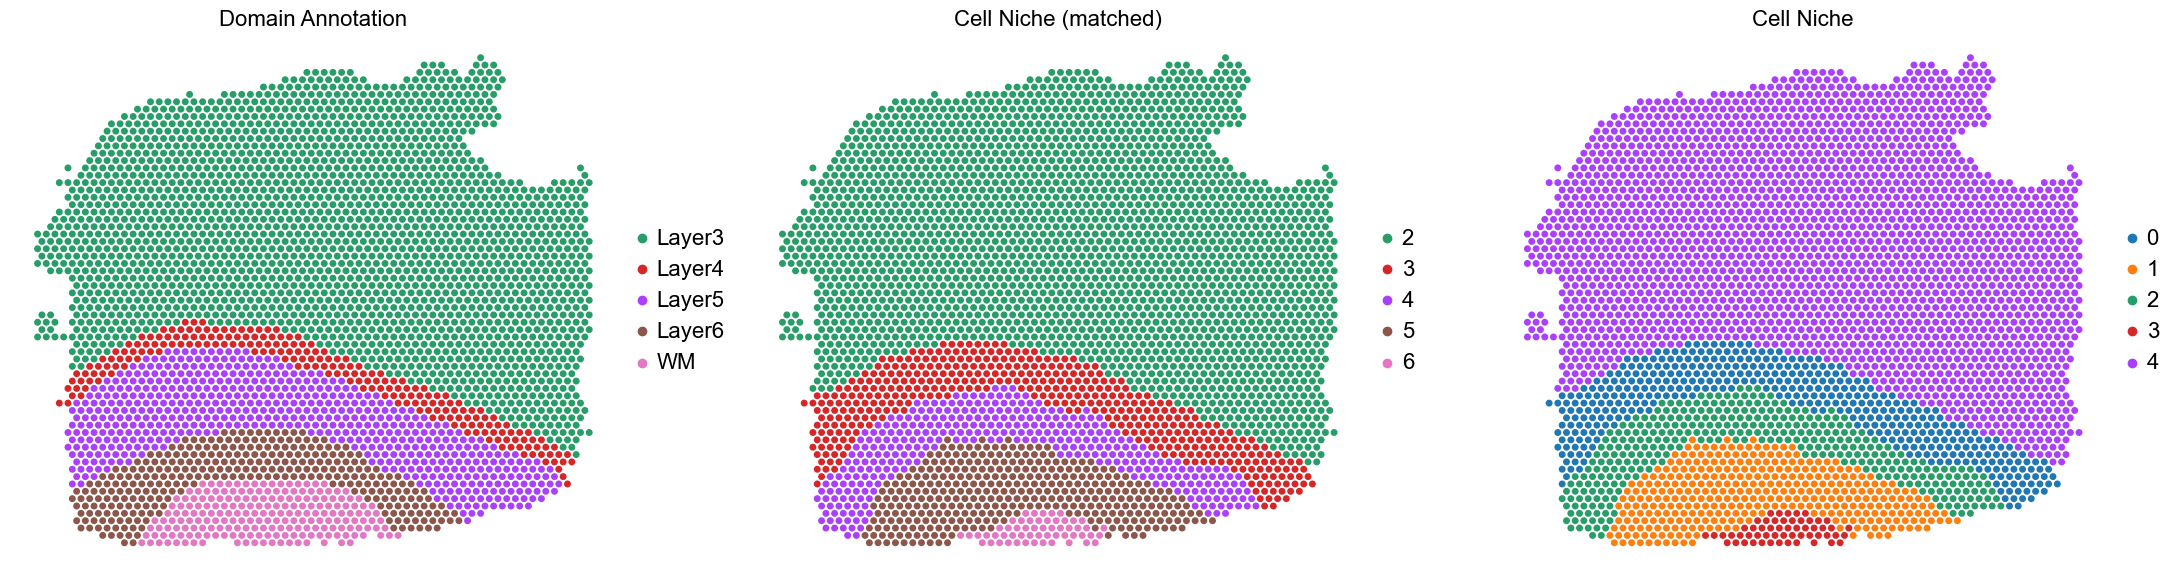
fig, axes = plt.subplots(1, 3, figsize=(22, 6))
sc.pl.embedding(adata, basis='spatial', palette=domain_color_dict, color='Manual_Annotation',
ax=axes[0], s=100, show=False, frameon=False, title='Domain Annotation', legend_fontsize=16)
axes[0].set_title('Domain Annotation', fontsize=16)
axes[0].invert_yaxis()
sc.pl.embedding(adata, basis='spatial', palette=niche_color_dict, color='matched_cluster',
ax=axes[1], s=100, show=False, frameon=False, title='Cell Niche (matched)', legend_fontsize=16)
axes[1].set_title('Cell Niche (matched)', fontsize=16)
axes[1].invert_yaxis()
sc.pl.embedding(adata, basis='spatial', palette=niche_color_dict, color='niche_label',
ax=axes[2], s=100, show=False, frameon=False, title='Cell Niche', legend_fontsize=16)
axes[2].set_title('Cell Niche', fontsize=16)
axes[2].invert_yaxis()
plt.tight_layout()
plt.show()
print(f'Median: ARI:{np.median(ari_scores): .4f} AMI:{np.median(ami_scores): .4f} mF1:{np.median(mf1_scores): .4f} wF1:{np.median(wf1_scores): .4f}')
print(f'Mean: ARI:{np.mean(ari_scores): .4f} AMI:{np.mean(ami_scores): .4f} mF1:{np.mean(mf1_scores): .4f} wF1:{np.mean(wf1_scores): .4f}')
151669
ARI:  0.7939, AMI:  0.7096, mF1:  0.6119, wF1:  0.7854
ARI: 0.7939 AMI: 0.7096 mF1: 0.6119 wF1: 0.7854
151670
ARI:  0.8337, AMI:  0.7324, mF1:  0.5460, wF1:  0.7823
ARI: 0.8337 AMI: 0.7324 mF1: 0.5460 wF1: 0.7823
151671
ARI:  0.8188, AMI:  0.7562, mF1:  0.7809, wF1:  0.8604
ARI: 0.8188 AMI: 0.7562 mF1: 0.7809 wF1: 0.8604
151672
ARI:  0.7636, AMI:  0.7431, mF1:  0.7262, wF1:  0.7974
ARI: 0.7636 AMI: 0.7431 mF1: 0.7262 wF1: 0.7974
Median: ARI: 0.8063 AMI: 0.7378 mF1: 0.6690 wF1: 0.7914
Mean: ARI: 0.8025 AMI: 0.7353 mF1: 0.6663 wF1: 0.8064
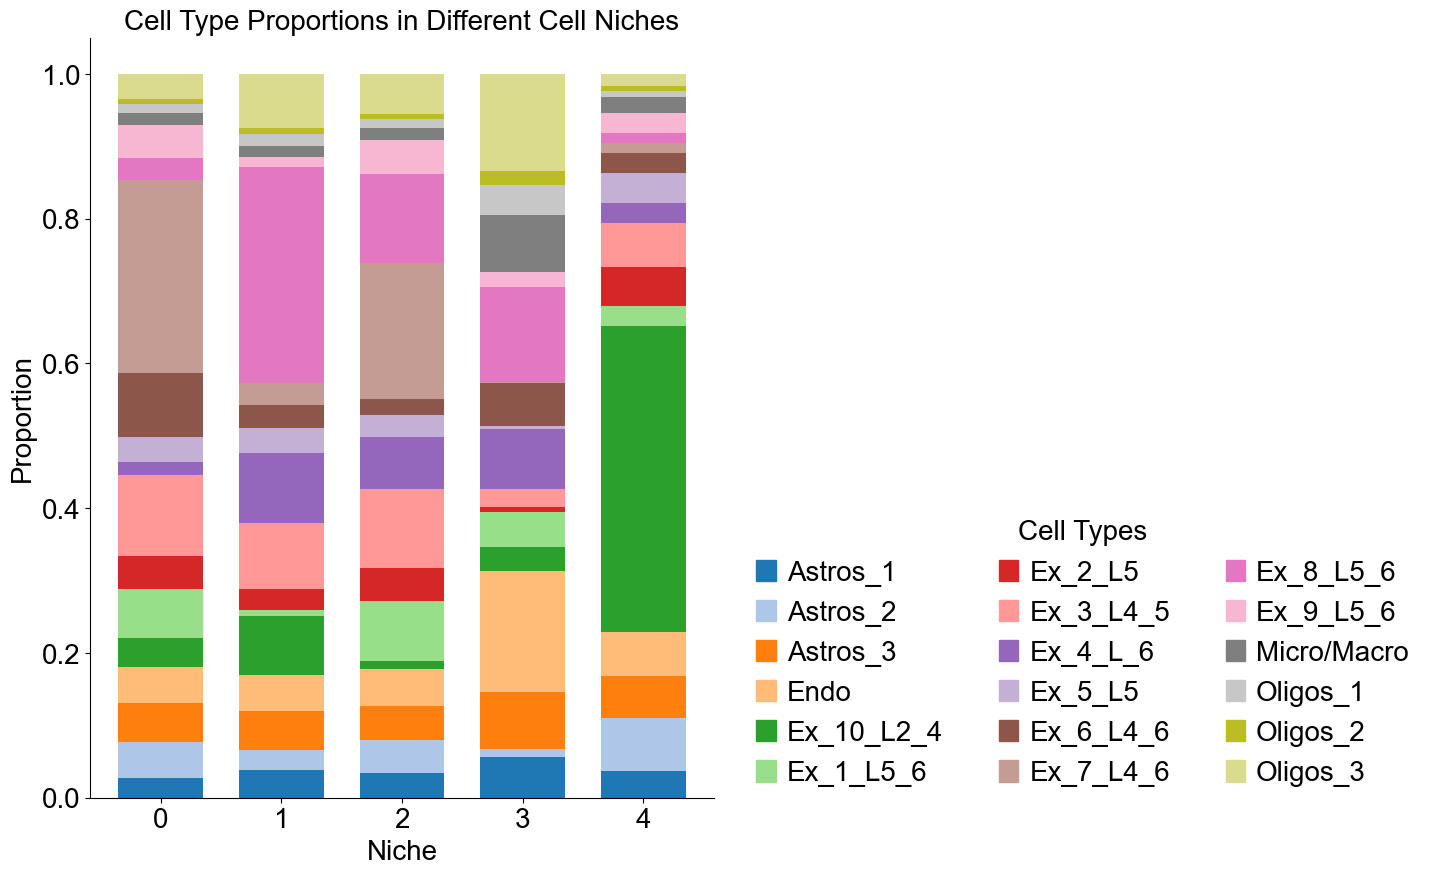
Cell type composition
[1905]:
niche_labels = adata_concat_new.uns['niche_label_summary'].copy()
ct_labels = celltype_list_use
niche_dist = adata_concat_new.uns['niche_dist'].toarray().copy()
cell_count_niche = adata_concat_new.uns['niche_cell_count'].copy()

fig, ax = plt.subplots(figsize=(8, 10))
bar_width = 0.7
n_niches, n_cell_types = niche_dist.shape

x = np.arange(n_niches)

for j in range(n_cell_types):
    bottom = np.sum(niche_dist[:, :j], axis=1)
    ax.bar(x,
           niche_dist[:, j],
           bottom=bottom,
           width=bar_width,
           color=ct_color_dict[ct_labels[j]],
           label=ct_labels[j])

ax.set_ylabel('Proportion', fontsize=20)
ax.set_xlabel('Niche', fontsize=20)
ax.set_xticks(x)
ax.set_xticklabels(niche_labels, rotation=0, ha='center')
ax.tick_params(axis='x', labelsize=20)
ax.tick_params(axis='y', labelsize=20)
ax.spines['top'].set_visible(False)
ax.spines['right'].set_visible(False)
ax.grid(False)

handles = [
    mpatches.Patch(color=color, label=ct)
    for ct, color in zip(celltype_list_use, ct_colors)
]

ax.legend(handles=handles, title='Cell Types', loc=(1.05, 0.0), frameon=False, handleheight=0.8,
          handlelength=0.7, ncol=3, fontsize=20, title_fontsize=20)

plt.title('Cell Type Proportions in Different Cell Niches', fontsize=20)
plt.tight_layout()
plt.show()
Cell type enrichment analysis
[1906]:
idx2ct_dict = {str(k): celltype_list_use[k] for k in range(len(celltype_list_use))}
ct_df = ct_enrichment_test(adata_concat_new.uns['niche_dist'],
                           adata_concat_new.uns['niche_cell_count'],
                           idx2ct_dict,
                           adata_concat_new.uns['niche_label_summary'],
                           method='fisher',
                           alpha=0.05,
                           fdr_method='fdr_by',
                           log2fc_threshold=1,
                           prop_threshold=0.01,
                           verbose=True,
                           )
ct_df.head()
5 niches and 18 cell types in total.
[1906]:
| niche_idx | niche | celltype_idx | celltype | oddsratio | p-value | q-value | log2fc | prop | enrichment | |
|---|---|---|---|---|---|---|---|---|---|---|
| 0 | 0 | 0 | 0 | Astros_1 | 0.712178 | 1.599932e-02 | 1.240439e-01 | -0.450918 | 0.027849 | False |
| 1 | 0 | 0 | 1 | Astros_2 | 0.856987 | 1.630556e-01 | 1.000000e+00 | -0.205675 | 0.049658 | False |
| 2 | 0 | 0 | 2 | Astros_3 | 0.910571 | 4.138638e-01 | 1.000000e+00 | -0.128975 | 0.053334 | False |
| 3 | 0 | 0 | 3 | Endo | 0.746838 | 6.059293e-03 | 4.862650e-02 | -0.384732 | 0.049888 | False |
| 4 | 0 | 0 | 4 | Ex_10_L2_4 | 0.103247 | 1.063771e-164 | 6.951457e-163 | -2.846481 | 0.039350 | False |
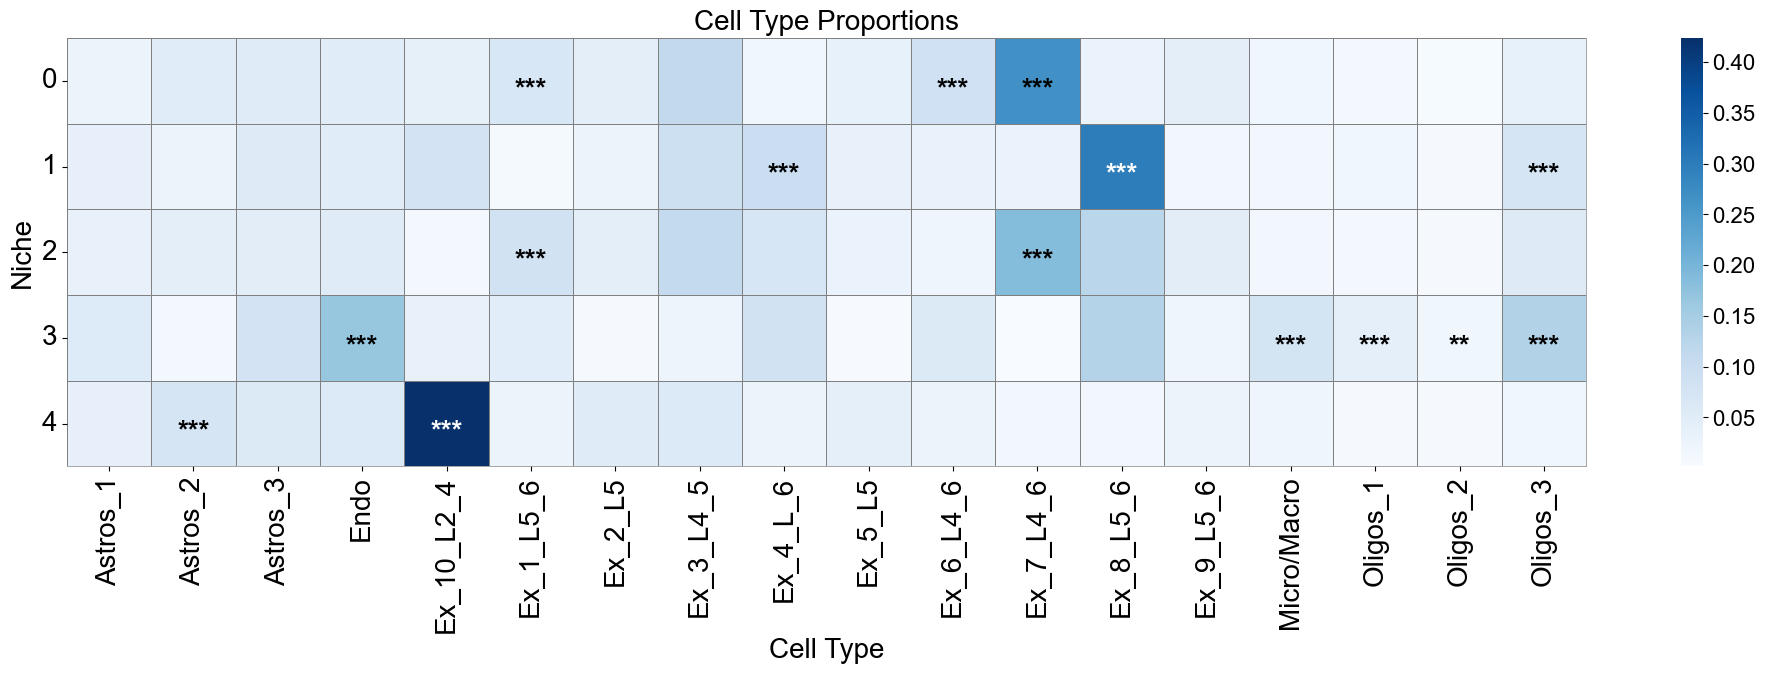
[1907]:
niche_labels = adata_concat_new.uns['niche_label_summary'].copy()
ct_labels = celltype_list_use
matrix_df = pd.DataFrame(
data=adata_concat_new.uns['niche_dist'].toarray(),
index=niche_labels,
columns=ct_labels,
)
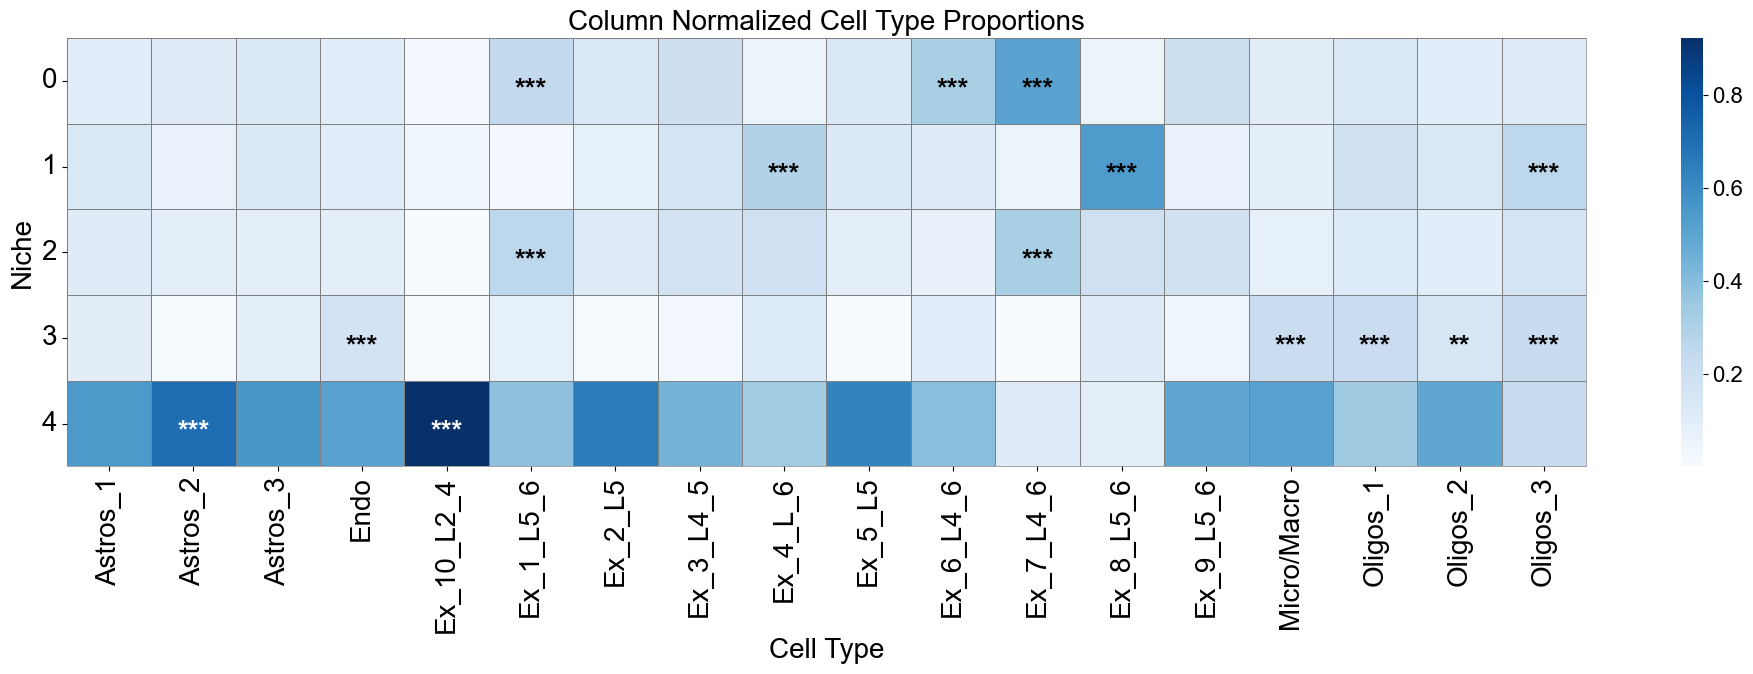
cn_dist_count = adata_concat_new.uns['niche_dist'].toarray() * adata_concat_new.uns['niche_cell_count'][:, np.newaxis]
cn_dist_norm = cn_dist_count / np.sum(cn_dist_count, axis=0)
matrix_df_norm = pd.DataFrame(
data=cn_dist_norm,
index=niche_labels,
columns=ct_labels,
)
ct_df['stars'] = ct_df['q-value'].apply(p2stars)
stars_df = pd.DataFrame(
'',
index=matrix_df.index,
columns=matrix_df.columns
)
for _, row in ct_df[ct_df['enrichment']].iterrows():
niche = row['niche']
ct = row['celltype']
if (niche in stars_df.index) and (ct in stars_df.columns):
stars_df.loc[niche, ct] = row['stars']
fig, axes = plt.subplots(1, 1, figsize=(20, 7))
sns_heatmap_0 = sns.heatmap(
matrix_df,
cmap='Blues',
# cbar_kws={'label': 'Cell type proportion'},
linewidths=0.5,
linecolor='gray',
# square=True,
ax=axes
)
for i, niche in enumerate(matrix_df.index):
for j, ct in enumerate(matrix_df.columns):
star = stars_df.iloc[i, j]
if star:
if matrix_df.iloc[i, j] > np.max(matrix_df.values) * 0.7:
color='white'
else:
color='black'
axes.text(j + 0.5, i + 0.6, star, ha='center', va='center', color=color, fontsize=20, fontweight='bold')
n_rows, n_cols = matrix_df.shape
axes.plot([0, n_cols], [n_rows, n_rows], color='gray', linewidth=0.5, clip_on=False)
axes.plot([n_cols, n_cols], [0, n_rows], color='gray', linewidth=0.5, clip_on=False)
axes.set_xticklabels(axes.get_xticklabels(), rotation=90, ha='center', fontsize=20)
axes.set_yticklabels(axes.get_yticklabels(), rotation=0, ha='right', fontsize=20)
axes.set_ylabel('Niche', fontsize=20)
axes.set_xlabel('Cell Type', fontsize=20)
axes.set_title('Cell Type Proportions', fontsize=20)
axes.collections[0].colorbar.ax.yaxis.label.set_size(20)
axes.collections[0].colorbar.ax.tick_params(labelsize=16)
axes.grid(False)
plt.tight_layout()
plt.show()
fig, axes = plt.subplots(1, 1, figsize=(20, 7))
sns_heatmap_1 = sns.heatmap(
matrix_df_norm,
cmap='Blues',
# cbar_kws={'label': 'Cell type proportion'},
linewidths=0.5,
linecolor='gray',
# square=True,
ax=axes
)
for i, niche in enumerate(matrix_df.index):
for j, ct in enumerate(matrix_df.columns):
star = stars_df.iloc[i, j]
if star:
if matrix_df_norm.iloc[i, j] > np.max(matrix_df_norm.values) * 0.7:
color='white'
else:
color='black'
axes.text(j + 0.5, i + 0.6, star, ha='center', va='center', color=color, fontsize=20, fontweight='bold')
n_rows, n_cols = matrix_df.shape
axes.plot([0, n_cols], [n_rows, n_rows], color='gray', linewidth=0.5, clip_on=False)
axes.plot([n_cols, n_cols], [0, n_rows], color='gray', linewidth=0.5, clip_on=False)
axes.set_xticklabels(axes.get_xticklabels(), rotation=90, ha='center', fontsize=20)
axes.set_yticklabels(axes.get_yticklabels(), rotation=0, ha='right', fontsize=20)
axes.set_ylabel('Niche', fontsize=20)
axes.set_xlabel('Cell Type', fontsize=20)
axes.set_title('Column Normalized Cell Type Proportions', fontsize=20)
axes.collections[0].colorbar.ax.yaxis.label.set_size(20)
axes.collections[0].colorbar.ax.tick_params(labelsize=16)
axes.grid(False)
plt.tight_layout()
plt.show()