Downstream Analyses on MERFISH FC&S dataset
Need additional packages: scanpy seaborn networkx
Load the packages
[ ]:
%reload_ext autoreload
%autoreload 2

import os
import time
import scanpy as sc
import pandas as pd
import numpy as np
import anndata as ad
import seaborn as sns
import matplotlib.pyplot as plt
import matplotlib.patches as mpatches
from matplotlib_venn import venn3

from sklearn.metrics import adjusted_rand_score, adjusted_mutual_info_score, f1_score

from Harmonics import *

import warnings
warnings.filterwarnings("ignore")

sc.settings.verbosity = 0
sc.settings.set_figure_params(dpi=50, dpi_save=500)

from matplotlib import rcParams
rcParams["figure.dpi"] = 50
rcParams["savefig.dpi"] = 500
rcParams['pdf.fonttype'] = 42
rcParams['svg.fonttype'] = 'none'
rcParams['ps.fonttype'] = 42
# rcParams['font.family'] = 'Arial'
rcParams['savefig.transparent'] = True
[2]:
data_dir = '../../../Data/Spatial/Transcriptomics/MERFISH_FCandS_Allen2023/processed/'
save_dir = f'../../results/MERFISH_FCandS_Allen2023/Harmonics/'
if not os.path.exists(save_dir):
    os.makedirs(save_dir)
[3]:
import numpy as np
import pandas as pd
import networkx as nx

def match_cluster_labels(true_labels, est_labels):
    true_labels_arr = np.array(list(true_labels))
    est_labels_arr = np.array(list(est_labels))

    org_cat = list(np.sort(list(pd.unique(true_labels))))
    est_cat = list(np.sort(list(pd.unique(est_labels))))

    B = nx.Graph()
    B.add_nodes_from([i + 1 for i in range(len(org_cat))], bipartite=0)
    B.add_nodes_from([-j - 1 for j in range(len(est_cat))], bipartite=1)

    for i in range(len(org_cat)):
        for j in range(len(est_cat)):
            weight = np.sum((true_labels_arr == org_cat[i]) * (est_labels_arr == est_cat[j]))
            B.add_edge(i + 1, -j - 1, weight=-weight)

    match = nx.algorithms.bipartite.matching.minimum_weight_full_matching(B)

    if len(org_cat) >= len(est_cat):
        return np.array([match[-est_cat.index(c) - 1] - 1 for c in est_labels_arr])
    else:
        unmatched = [c for c in est_cat if not (-est_cat.index(c) - 1) in match.keys()]
        l = []
        for c in est_labels_arr:
            if (-est_cat.index(c) - 1) in match:
                l.append(match[-est_cat.index(c) - 1] - 1)
            else:
                l.append(len(org_cat) + unmatched.index(c))
        return np.array(l)


def p2stars(p):
    if p < 0.001:
        return '***'
    elif p < 0.01:
        return '**'
    elif p < 0.05:
        return '*'
    else:
        return ''
Load the result
[4]:
adata_concat = sc.read_h5ad(save_dir + f'Harmonics_result_all_0.h5ad')
slice_name_list = np.loadtxt(data_dir + f"slice_name_list_all.txt", dtype=str, delimiter=" ").tolist()
[5]:
domains = sorted(set(adata_concat.obs[f'domain_annotation']))
domain_color_dict = {f'{domains[i]}': sns.color_palette()[i] for i in range(len(domains))}

niches = sorted(set(adata_concat.obs['niche_label']))
niche_color_dict = {str(k): sns.color_palette()[k] for k in range(len(niches))}
niche_color_dict['1'], niche_color_dict['8'] = niche_color_dict['8'], niche_color_dict['1']

celltypes = ['Astro-1', 'Astro-2', 'Endo-1', 'Endo-2', 'Endo-3', 'Epen', 'ExN-L2/3-1', 'ExN-L2/3-2', 'ExN-L5-1', 'ExN-L5-2',
             'ExN-L5-3', 'ExN-L6-1', 'ExN-L6-2', 'ExN-L6-3', 'ExN-Olf', 'InN-Calb2-1', 'InN-Calb2-2', 'InN-Chat', 'InN-Lamp5',
             'InN-Lhx6', 'InN-Olf-1', 'InN-Olf-2', 'InN-Pvalb-1', 'InN-Pvalb-2', 'InN-Pvalb-3', 'InN-Sst-1', 'InN-Sst-2', 'InN-Vip',
             'MSN-D1-1', 'MSN-D1-2', 'MSN-D2', 'Macro', 'Micro-1', 'Micro-2', 'Micro-3', 'OPC', 'Olig-1', 'Olig-2', 'Olig-3', 'Peri-1',
             'Peri-2', 'T cell', 'Vlmc']
ct_colors = ['#ffff00', '#1ce6ff', '#ff34ff', '#ff4a46', '#008941', '#006fa6', '#a30059', '#ffdbe5', '#7a4900', '#0000a6', '#63ffac',
             '#b79762', '#004d43', '#8fb0ff', '#997d87', '#5a0007', '#809693', '#6a3a4c', '#1b4400', '#4a3b53', '#3b5dff', '#4fc601',
             '#ff2f80', '#61615a', '#ba0900', '#6b7900', '#00c2a0', '#ffaa92', '#ff90c9', '#b903aa', '#d16100', '#ddefff', '#000035',
             '#7b4f4b', '#a1c299', '#ffb500', '#0aa6d8', '#c2ffed', '#00846f', "#E6C697", "#D00C6E", "#699191", '#a079bf']
ct_color_dict = {celltypes[k]: ct_colors[k] for k in range(len(celltypes))}
[6]:
matched_clusters = match_cluster_labels(adata_concat.obs['domain_annotation'], adata_concat.obs[f'niche_label'])
matched_labels = [domains[idx] if idx < len(domains) else 'Unmatched' for idx in matched_clusters]
adata_concat.obs[f'matched_cluster'] = [str(label) for label in matched_clusters]
adata_concat.obs[f'matched_label'] = matched_labels
[7]:
adata_concat
[7]:
AnnData object with n_obs × n_vars = 378918 × 374
    obs: 'celltype_43', 'celltype_coarse', 'domain_annotation', 'donor_id', 'slice', 'age', 'development_stage', 'slice_name', 'celltype_idx', 'n_neighbors', 'niche_label_jsd', 'niche_label_jsd_v2', 'niche_label_fmi', 'niche_label_ari', 'niche_label_nmi', 'niche_label_asw', 'niche_label_js_asw', 'niche_label_fisher', 'niche_label_chi', 'niche_label_dbi', 'niche_label_dass_min', 'niche_label_dass_mean', 'niche_label_dafisher', 'niche_label_dachi', 'niche_label_0.09', 'niche_label_0.11', 'niche_label_20', 'niche_label_19', 'niche_label_18', 'niche_label_17', 'niche_label_16', 'niche_label_15', 'niche_label_14', 'niche_label_13', 'niche_label_12', 'niche_label_11', 'niche_label_10', 'niche_label_9', 'niche_label_8', 'niche_label_7', 'niche_label_6', 'niche_label_5', 'niche_label_4', 'niche_label_3', 'niche_label_2', 'niche_label', 'matched_cluster', 'matched_label'
    uns: 'ct2idx', 'idx2ct', 'niche_cell_count', 'niche_dist', 'niche_label_summary', 'score_dict'
    obsm: 'micro_dist', 'onehot', 'spatial'
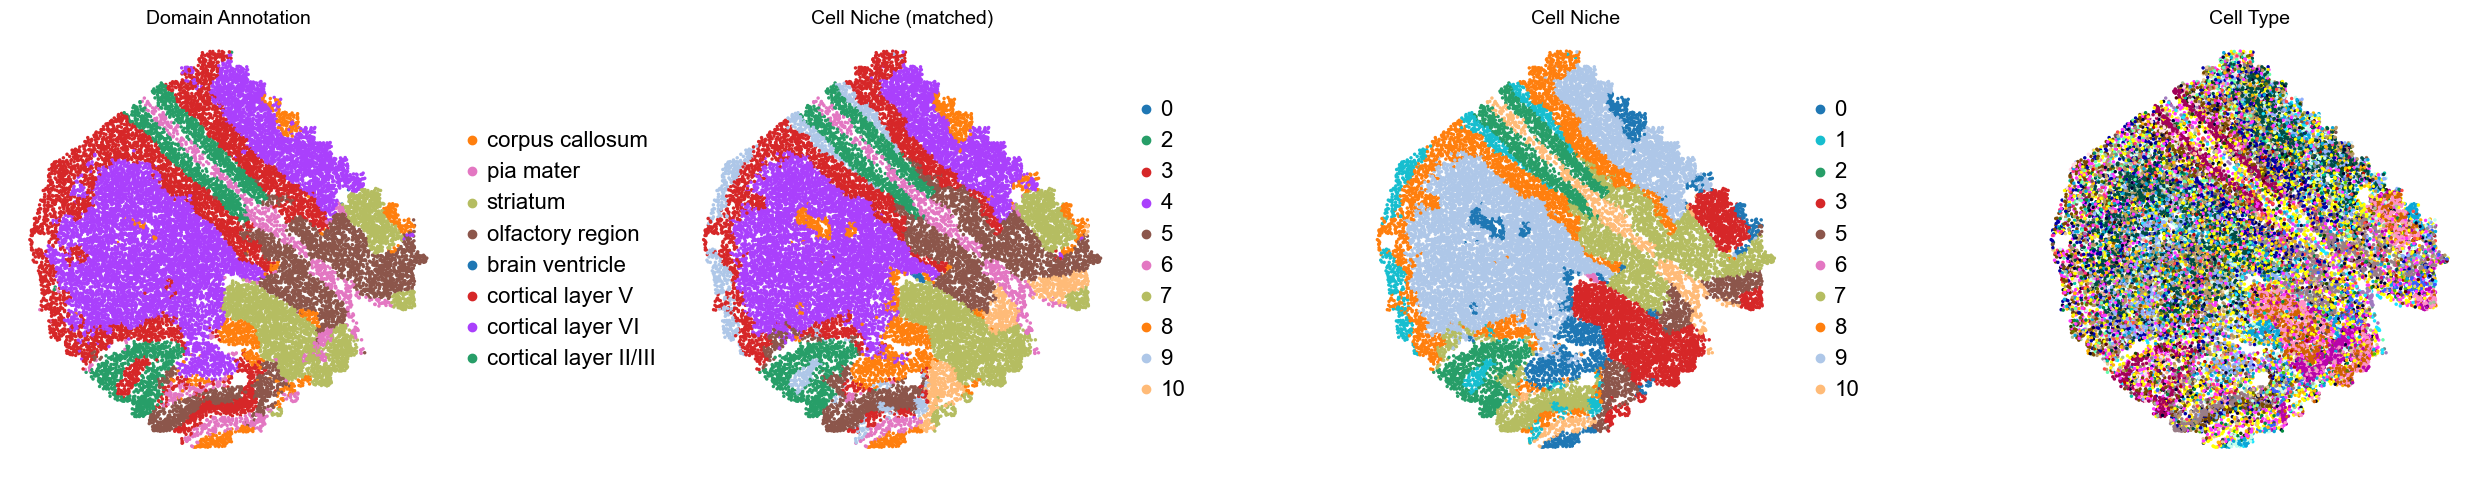
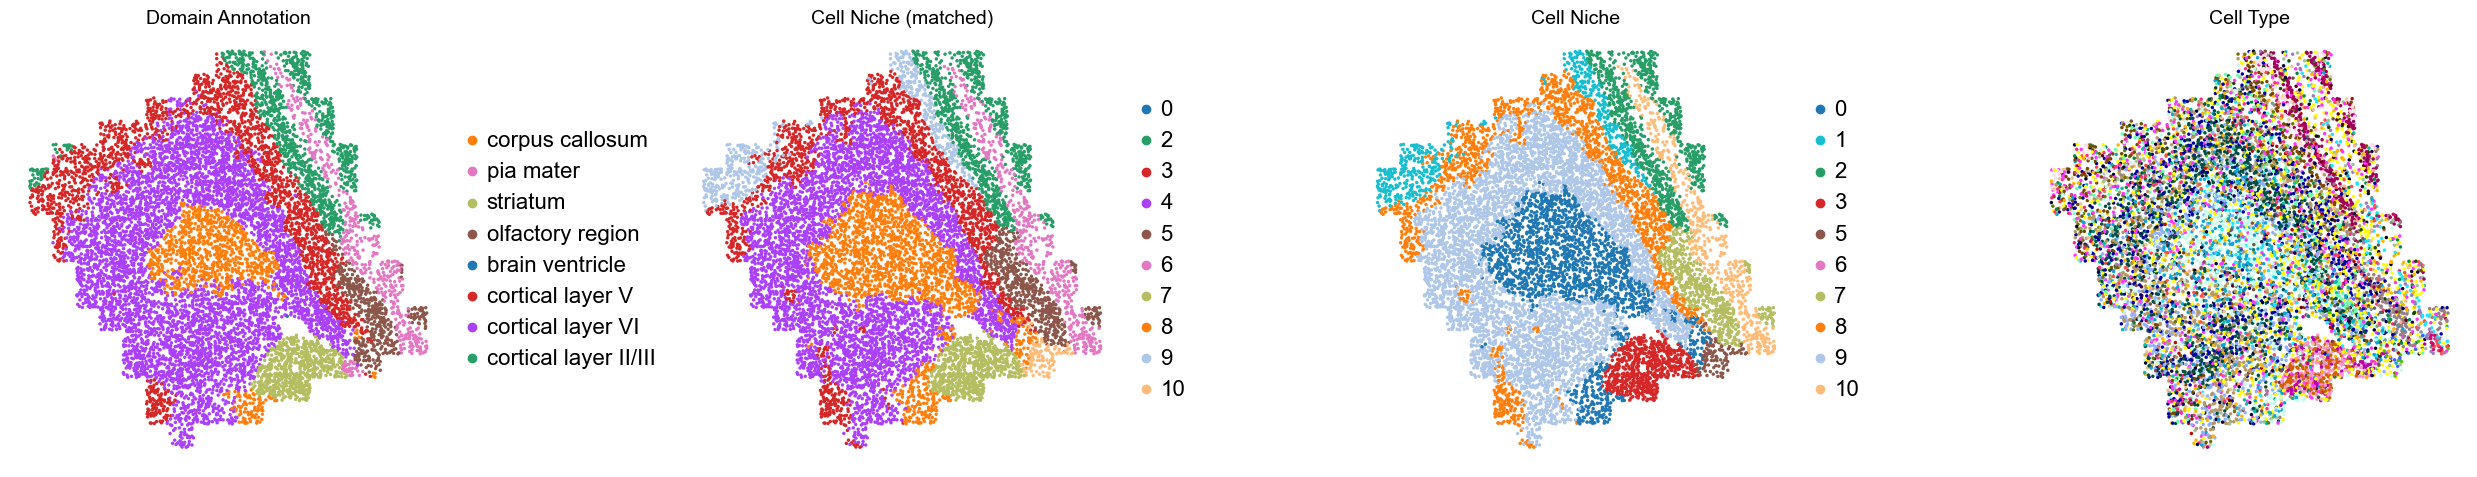
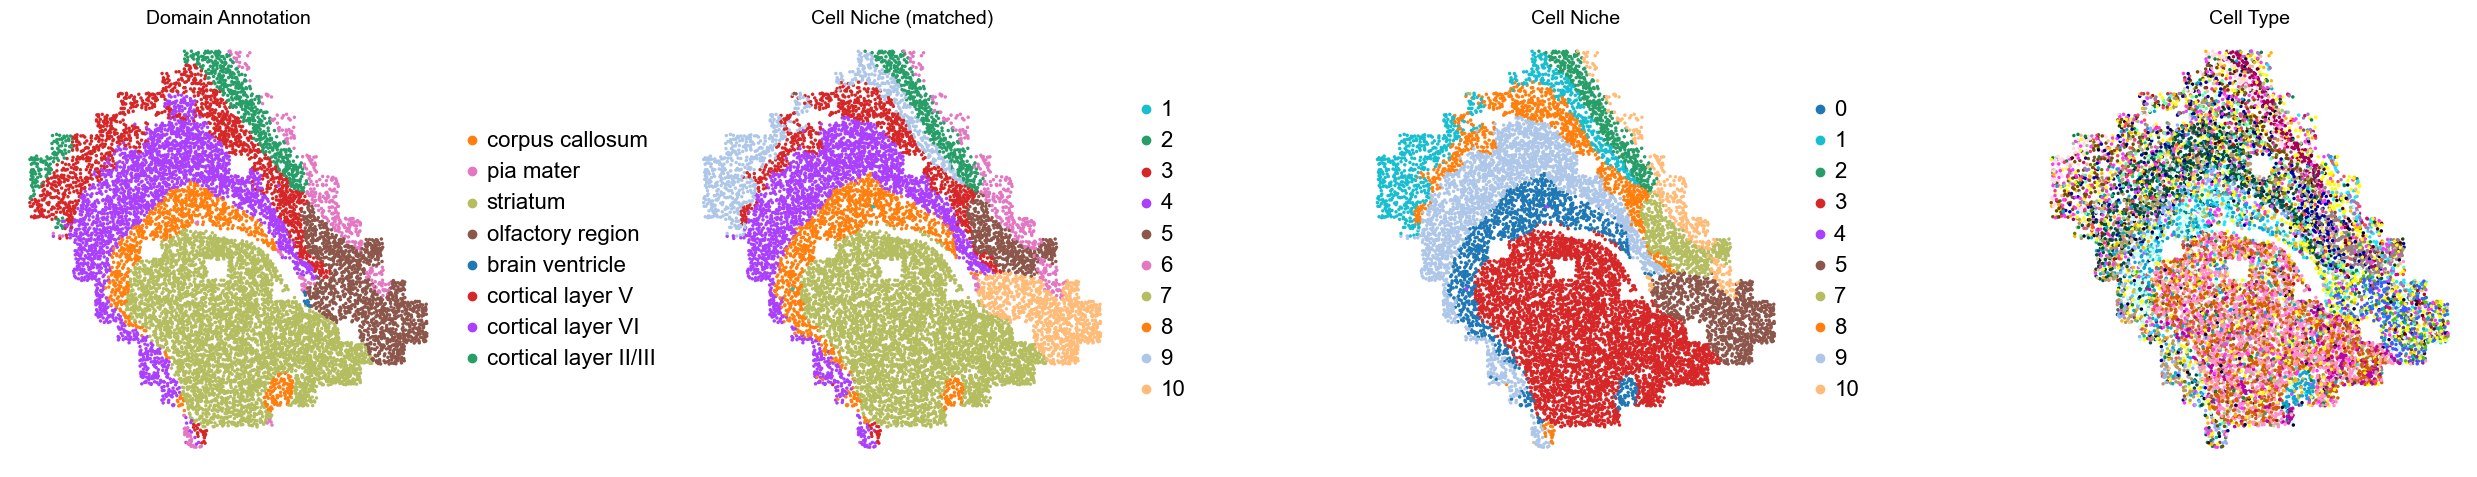
Plot the results
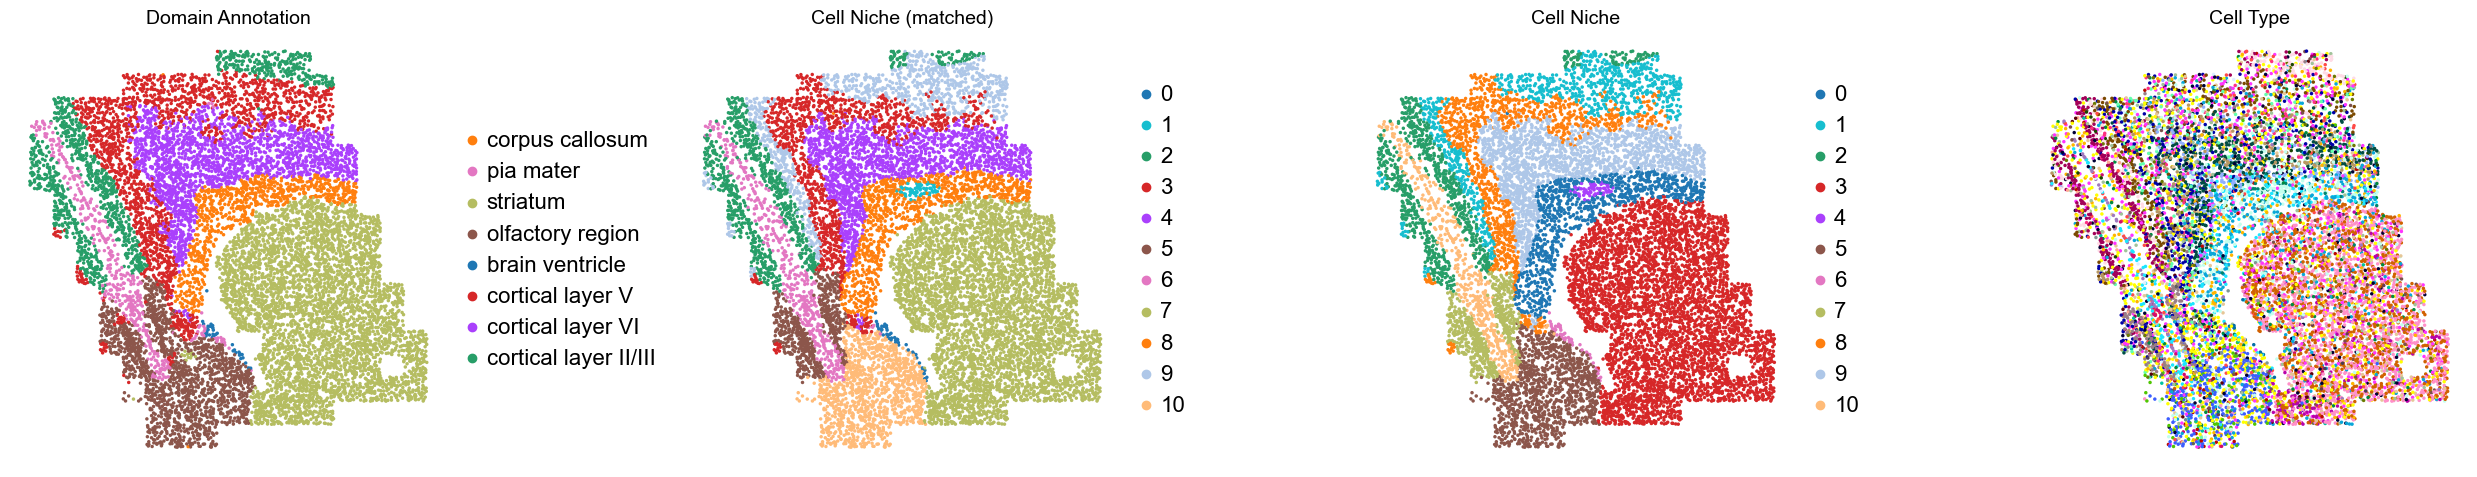
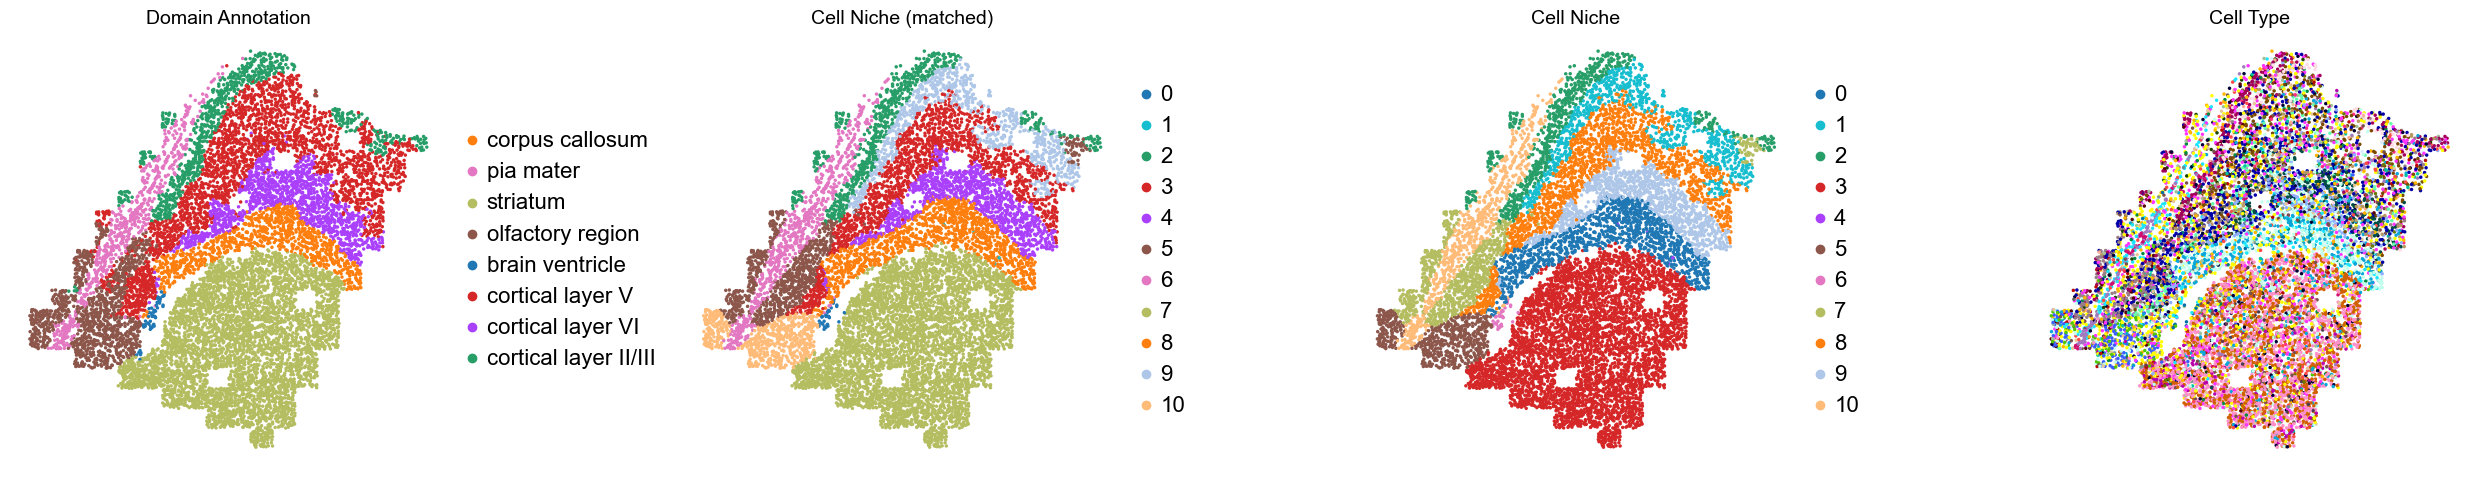
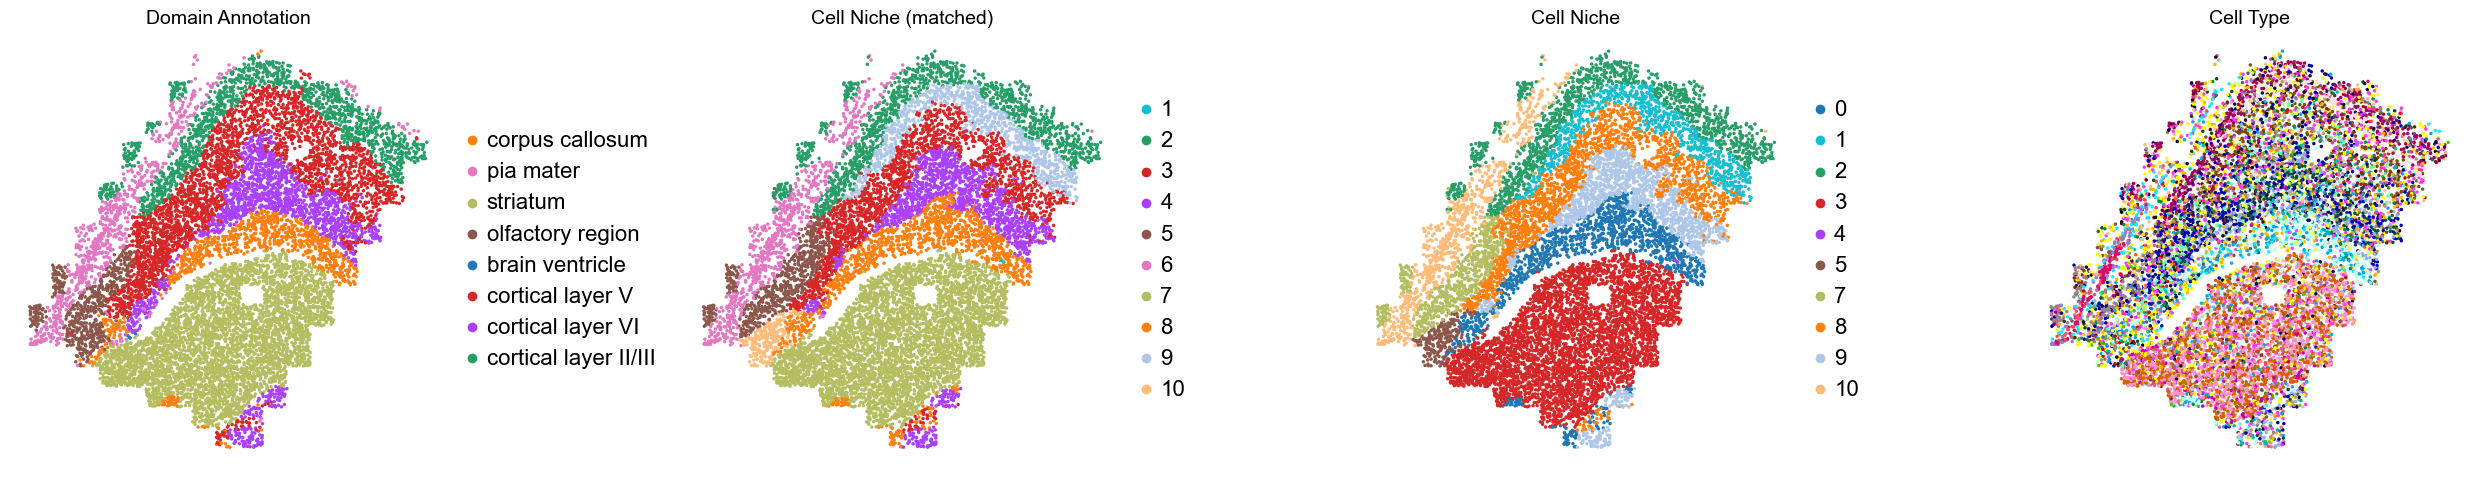
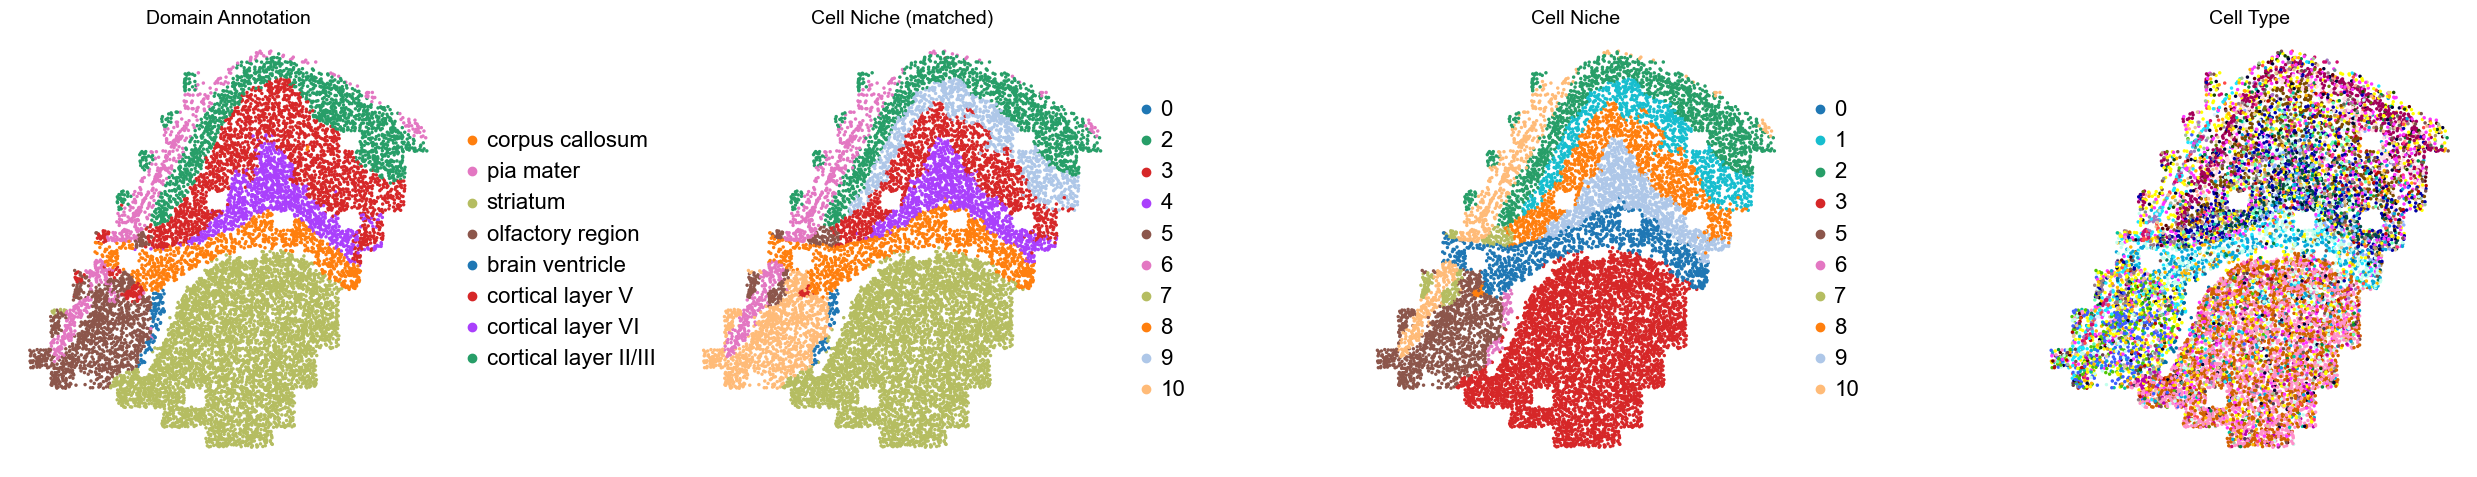
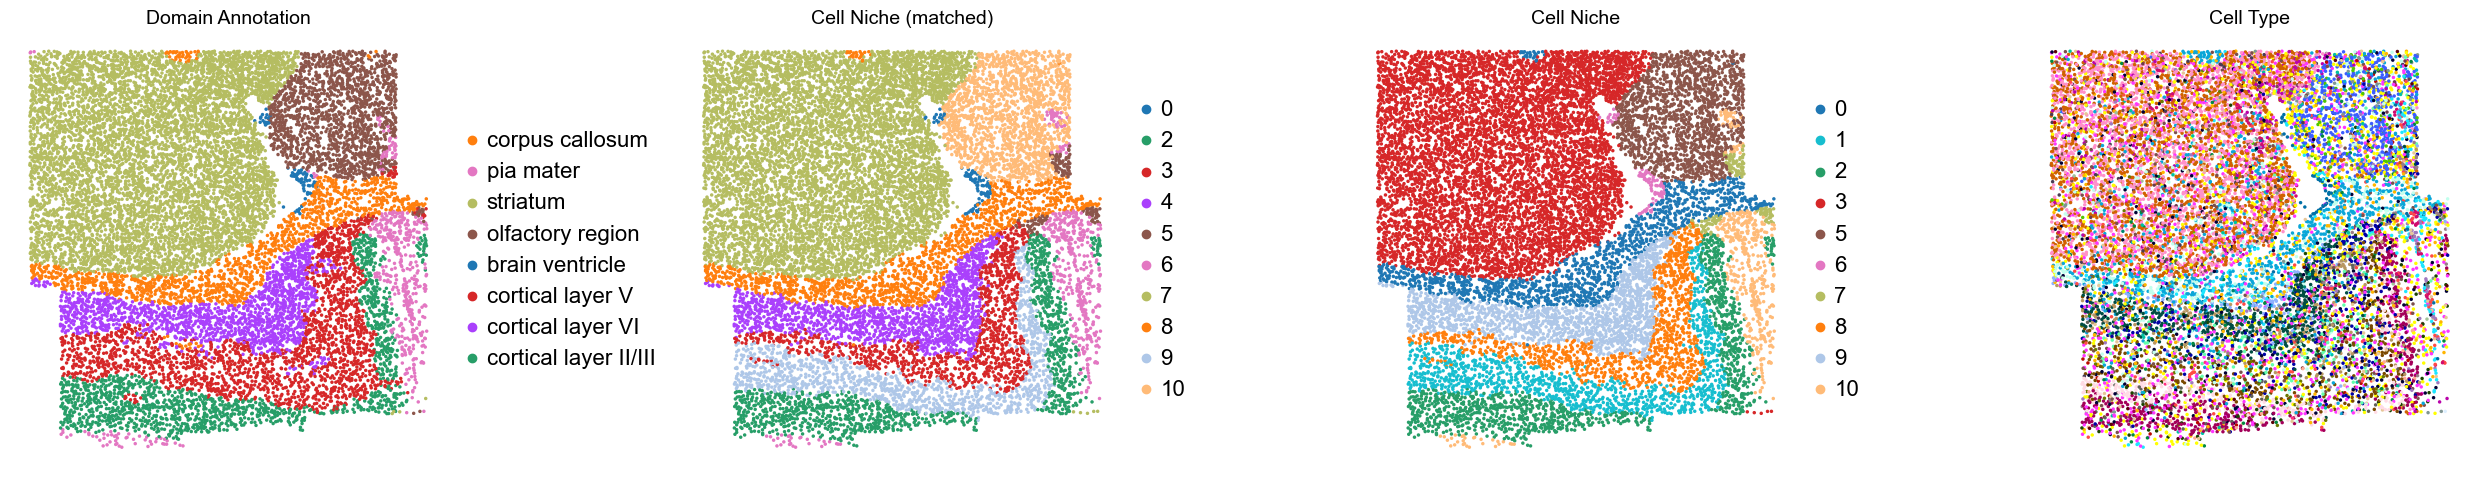
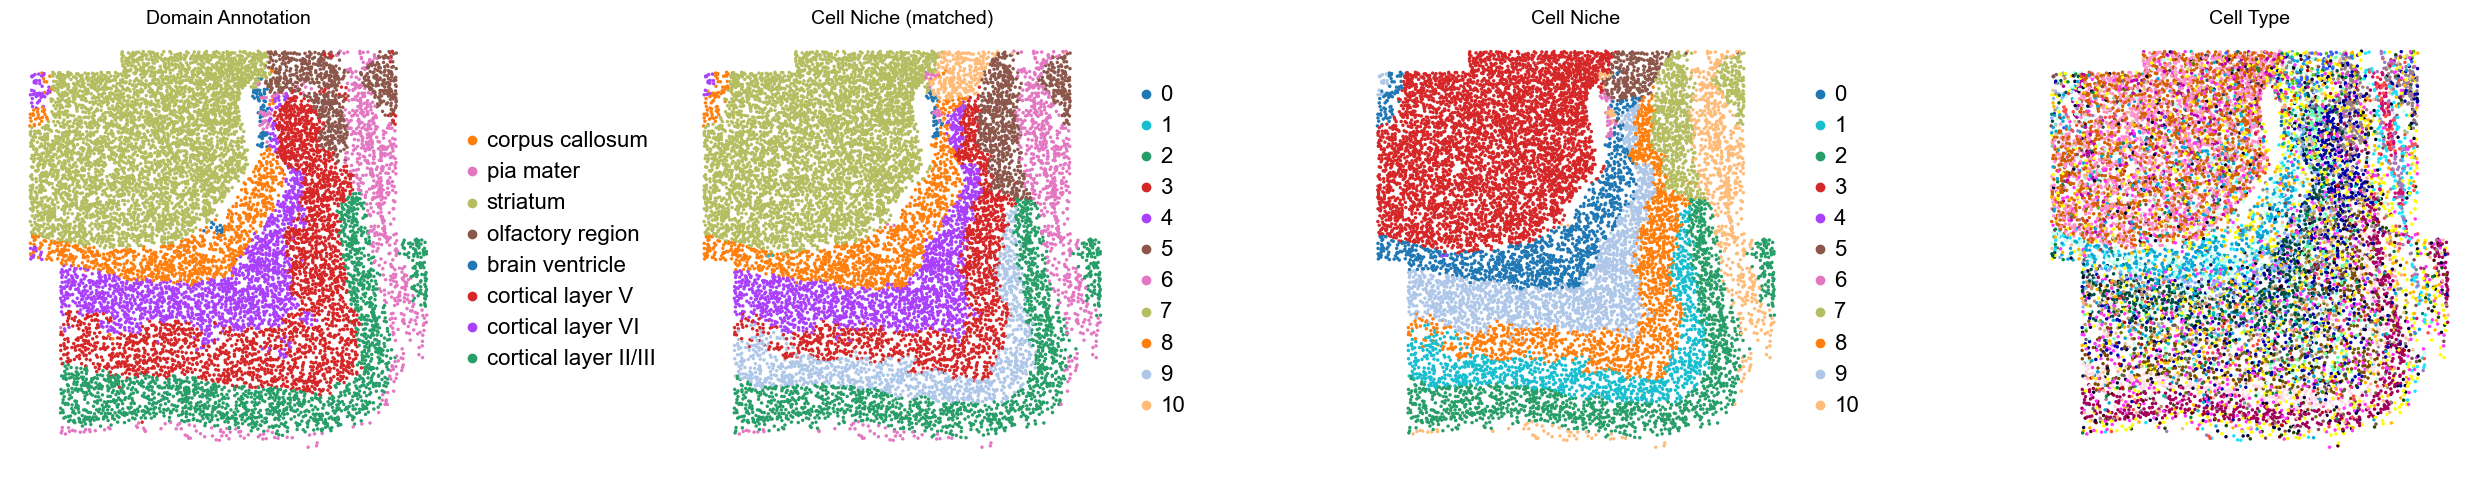
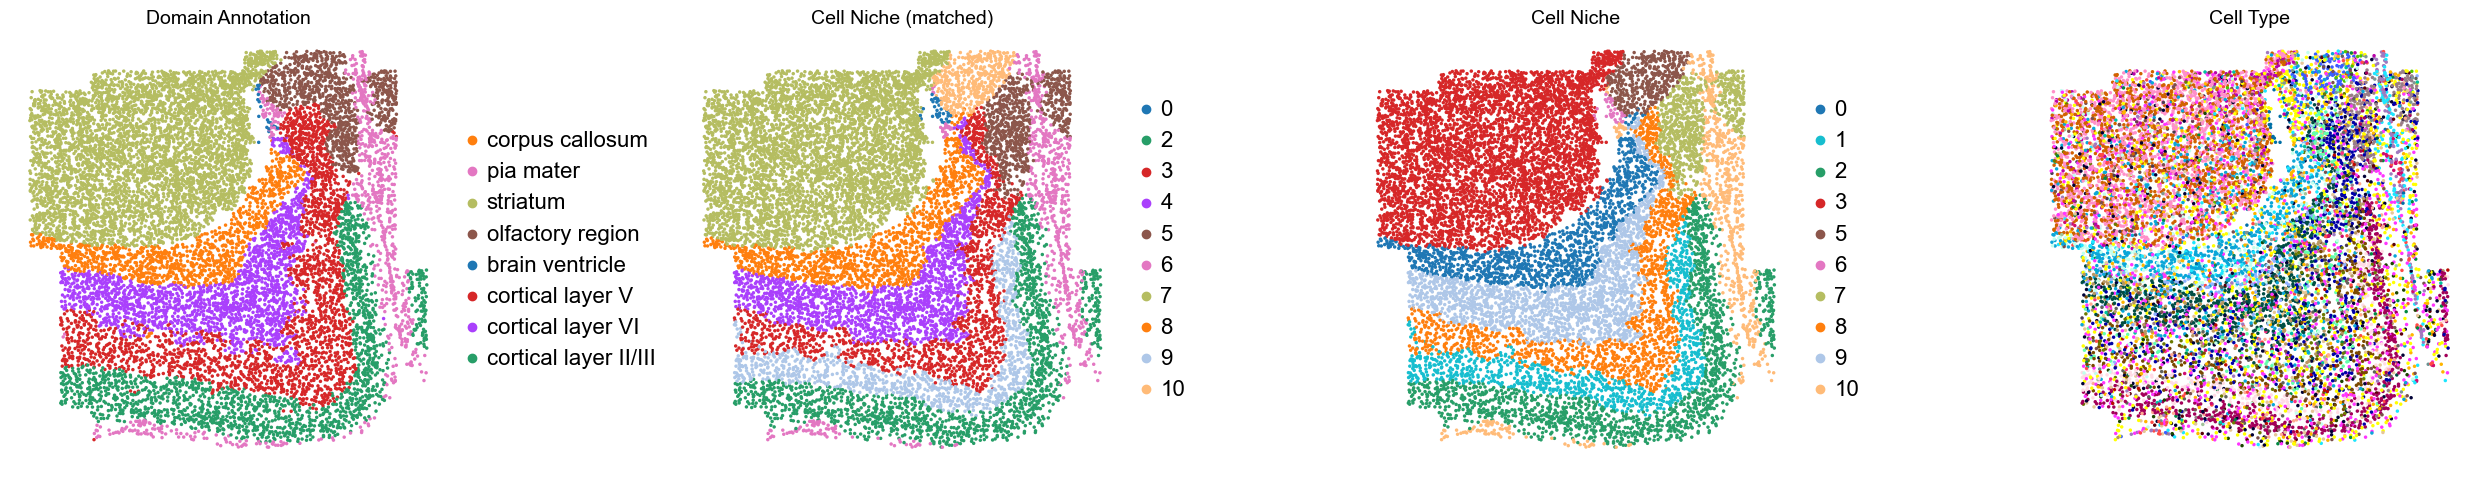
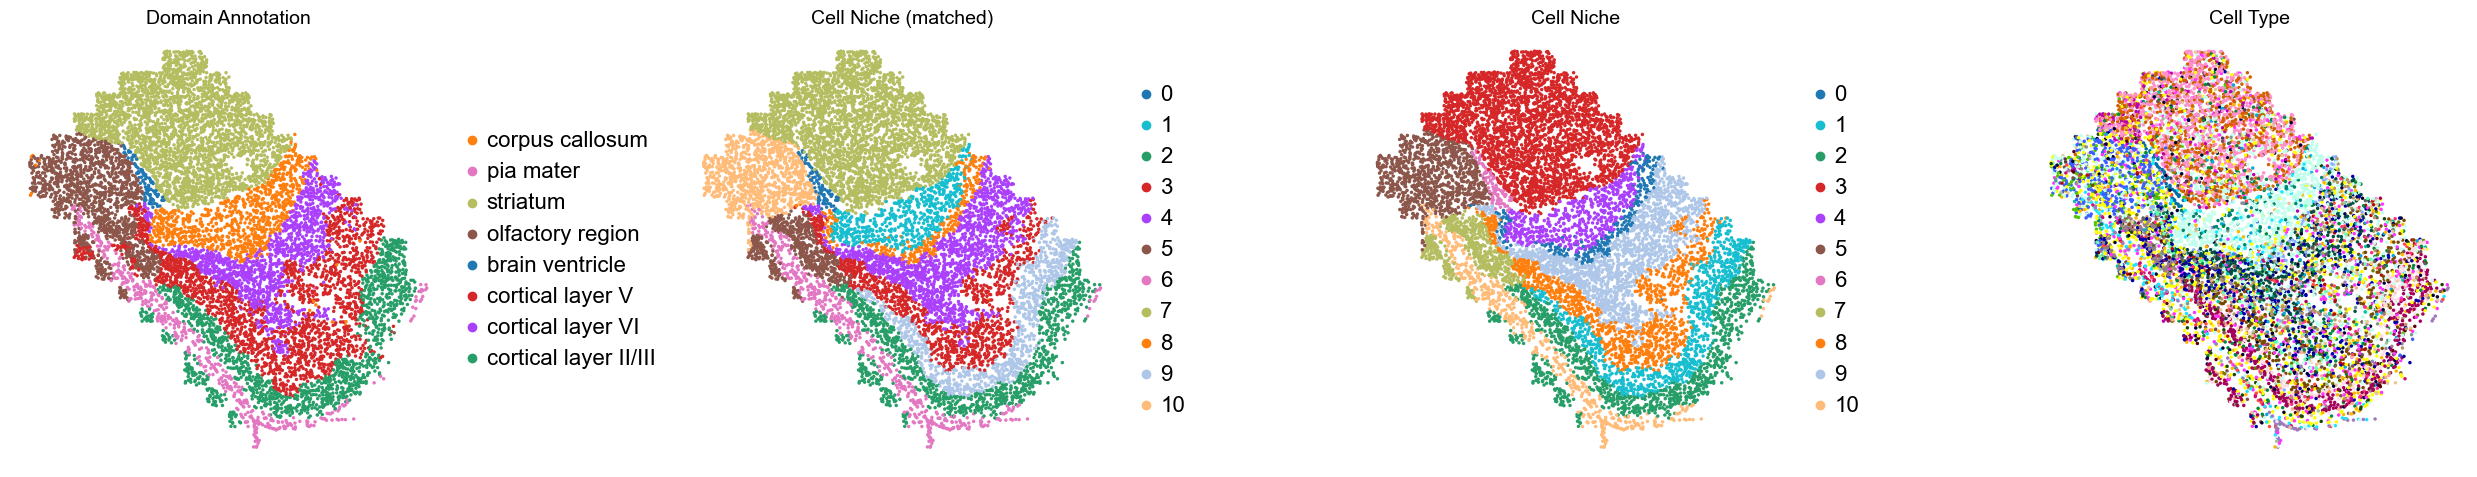
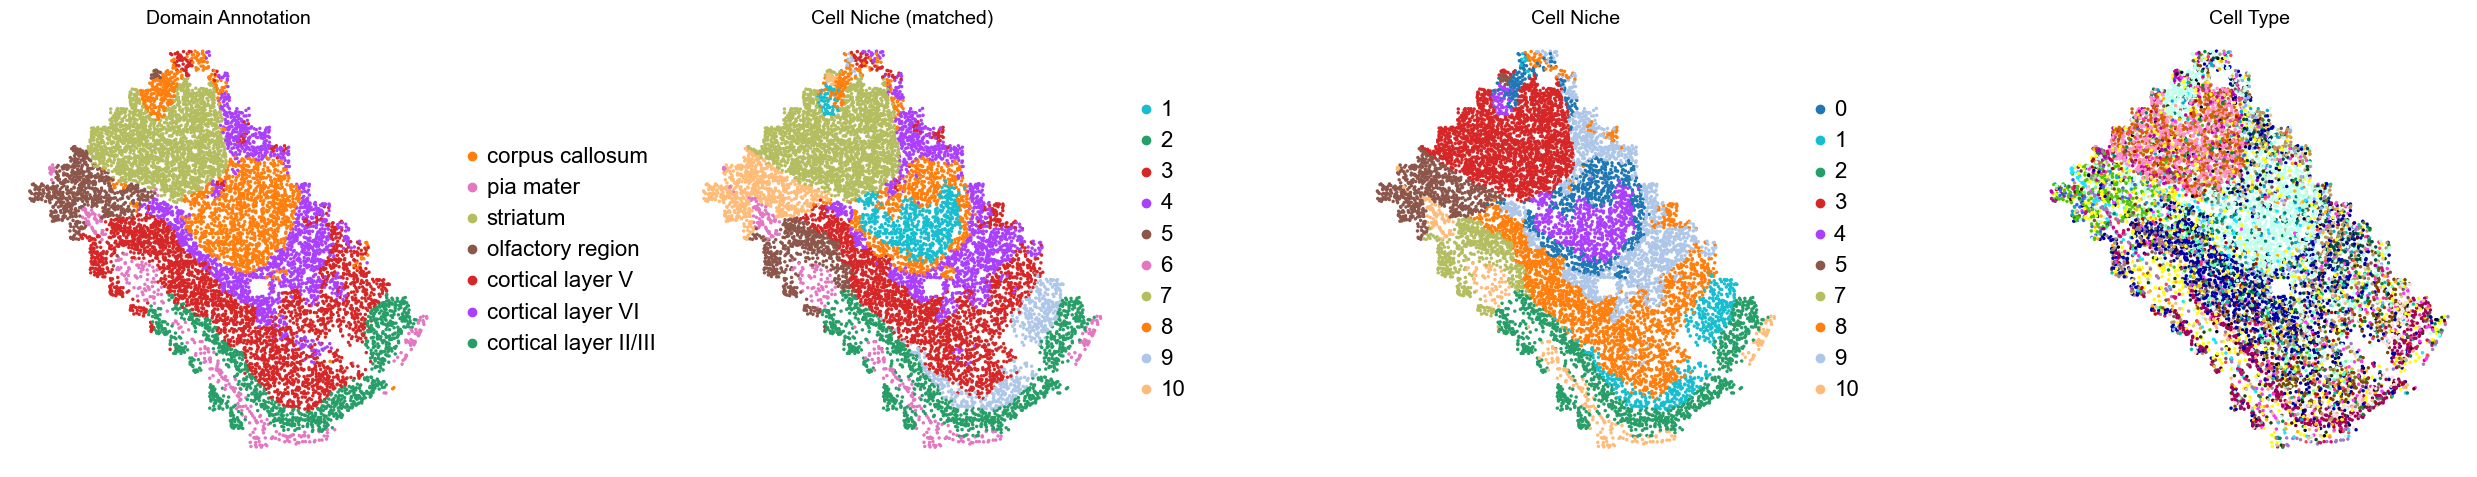
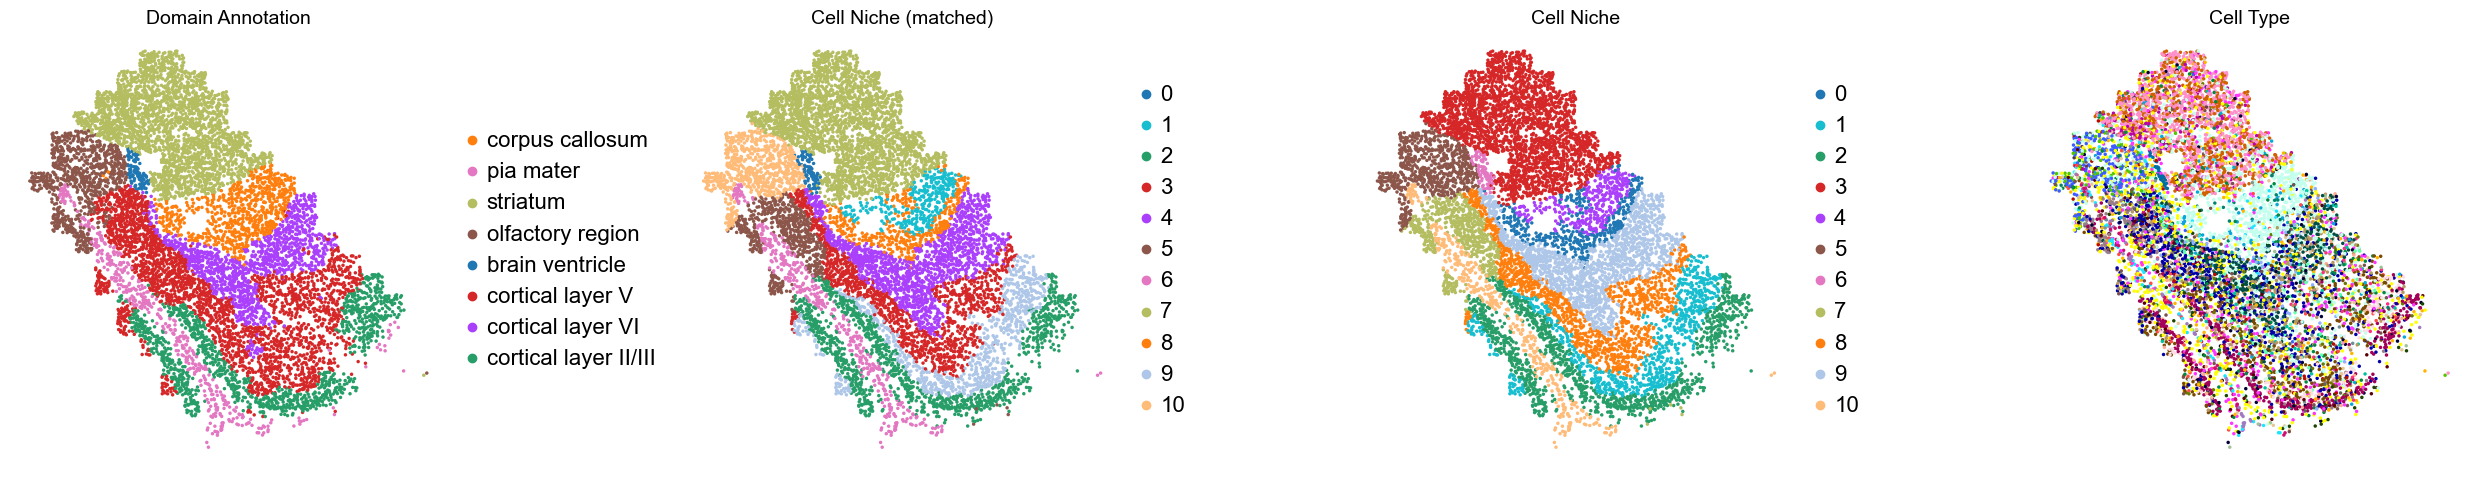
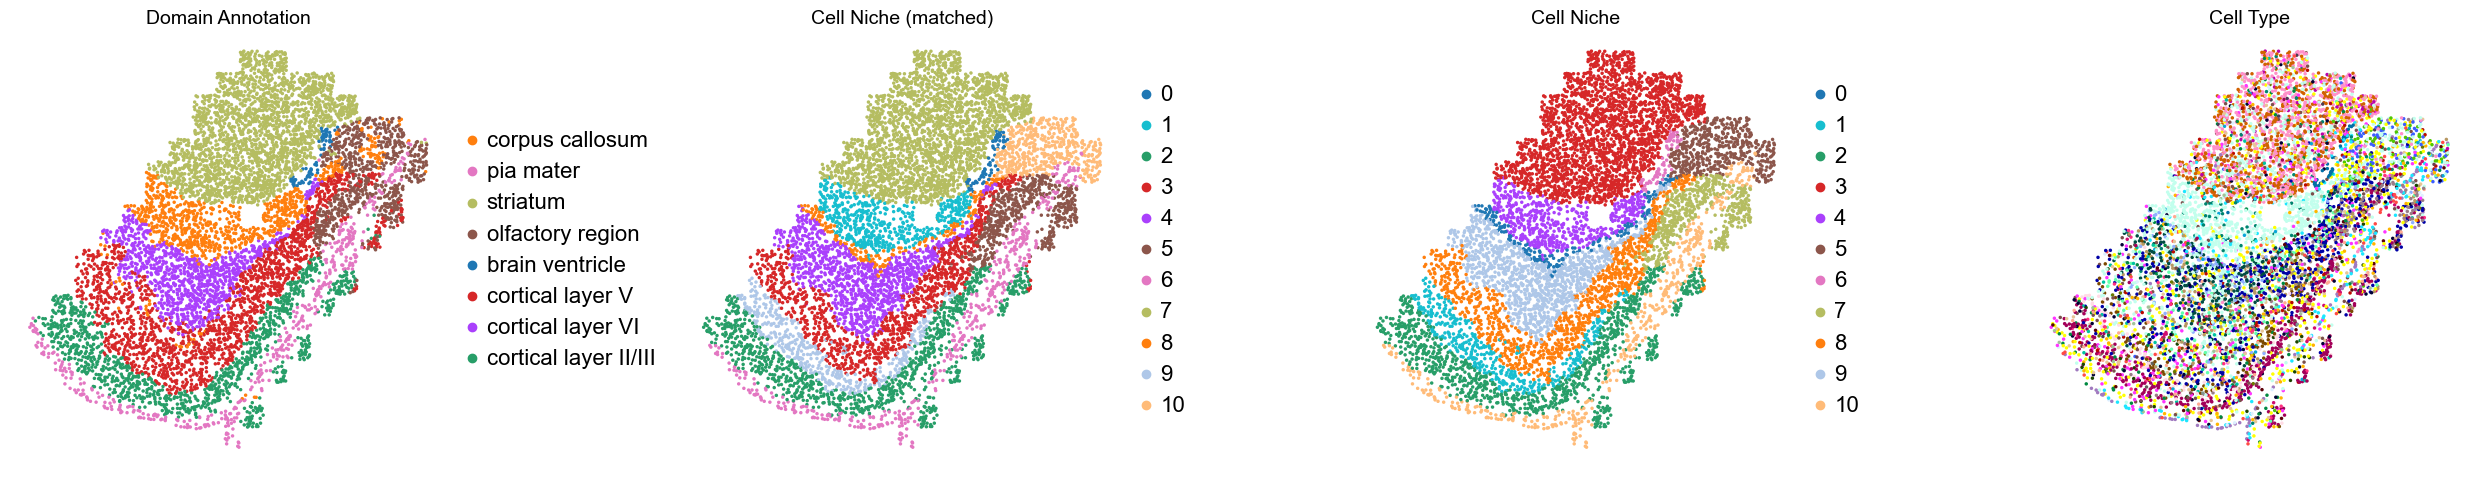
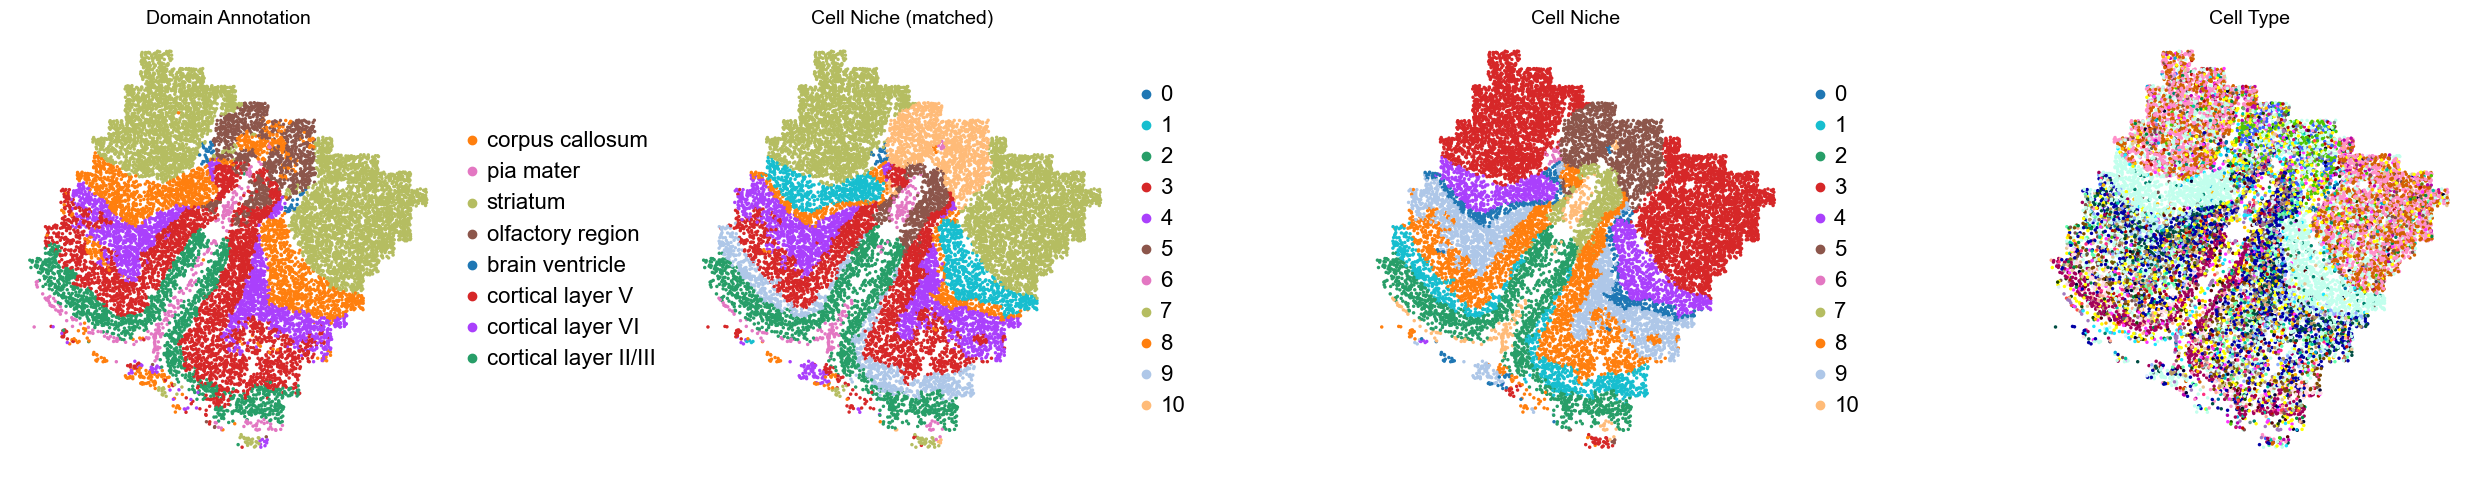
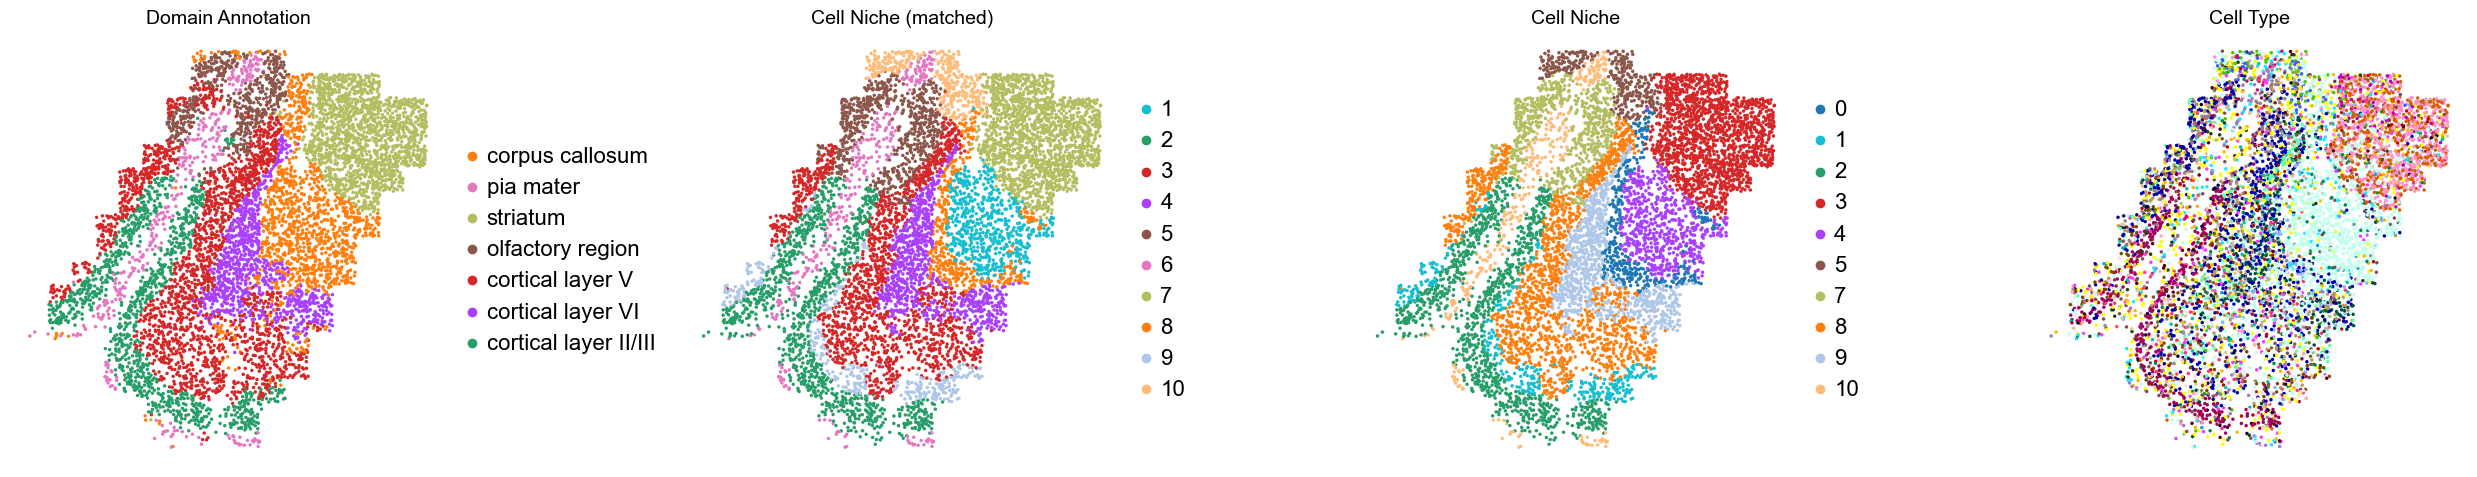
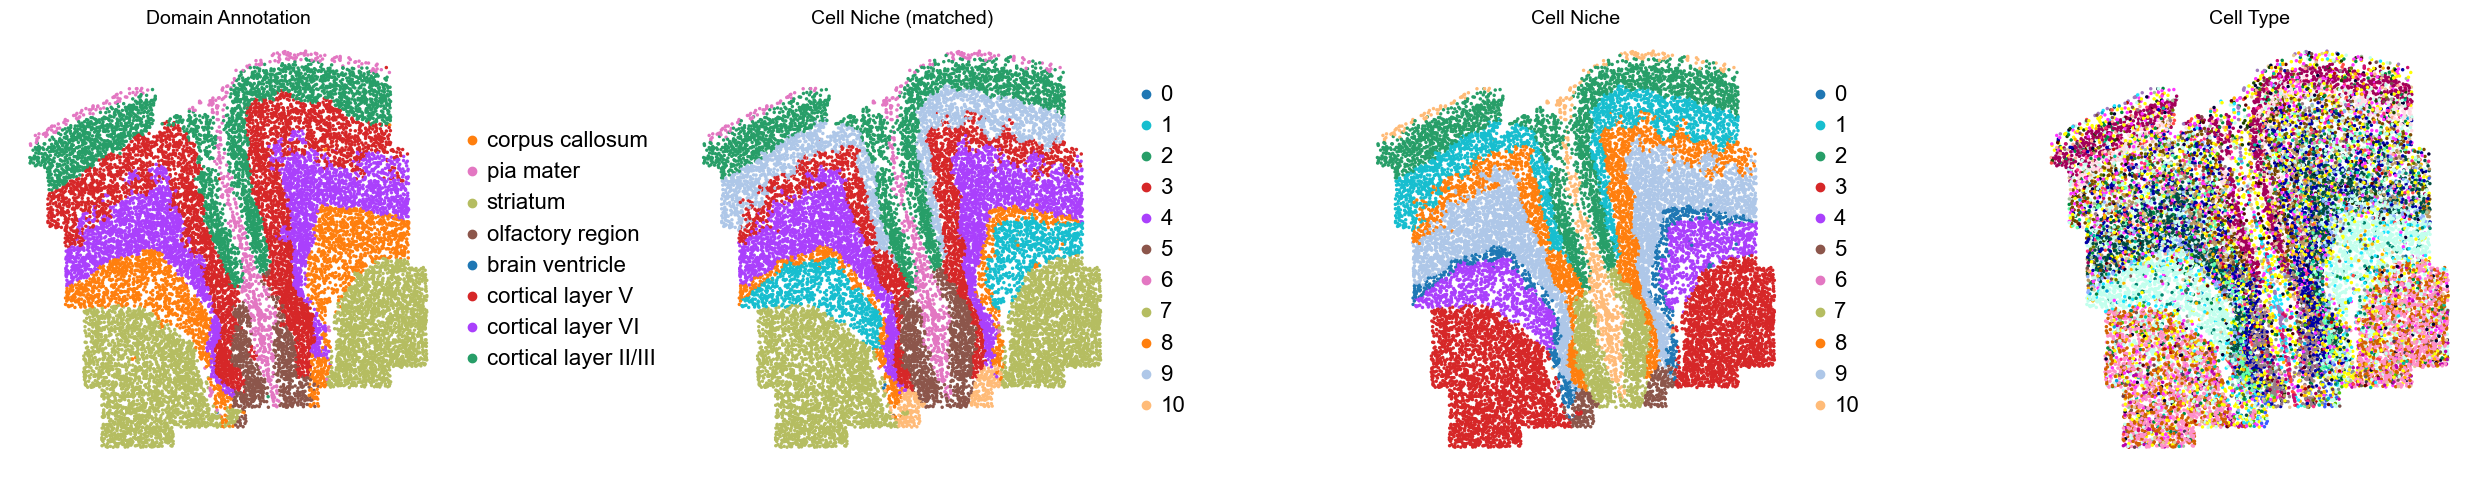
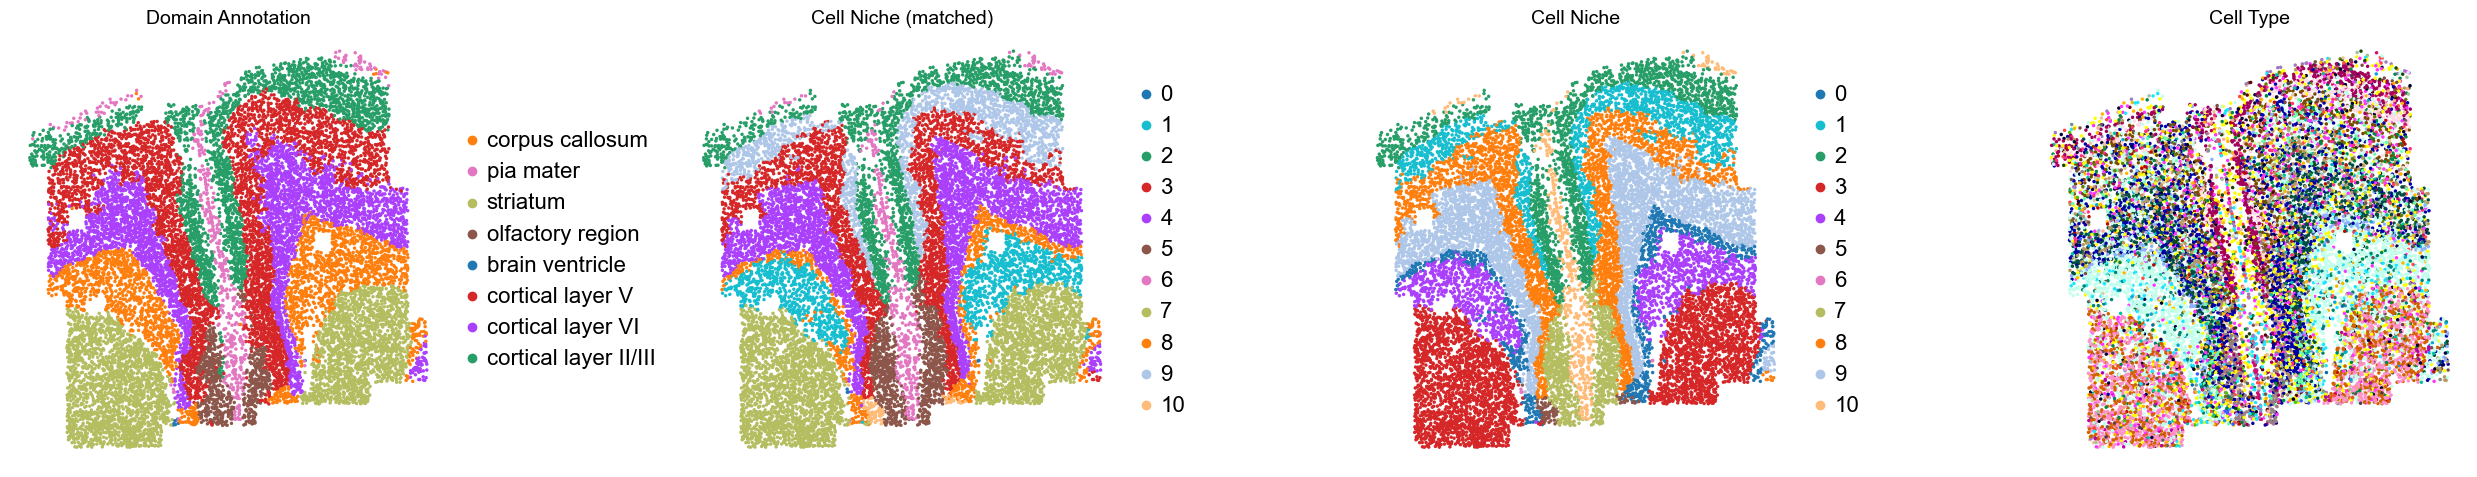
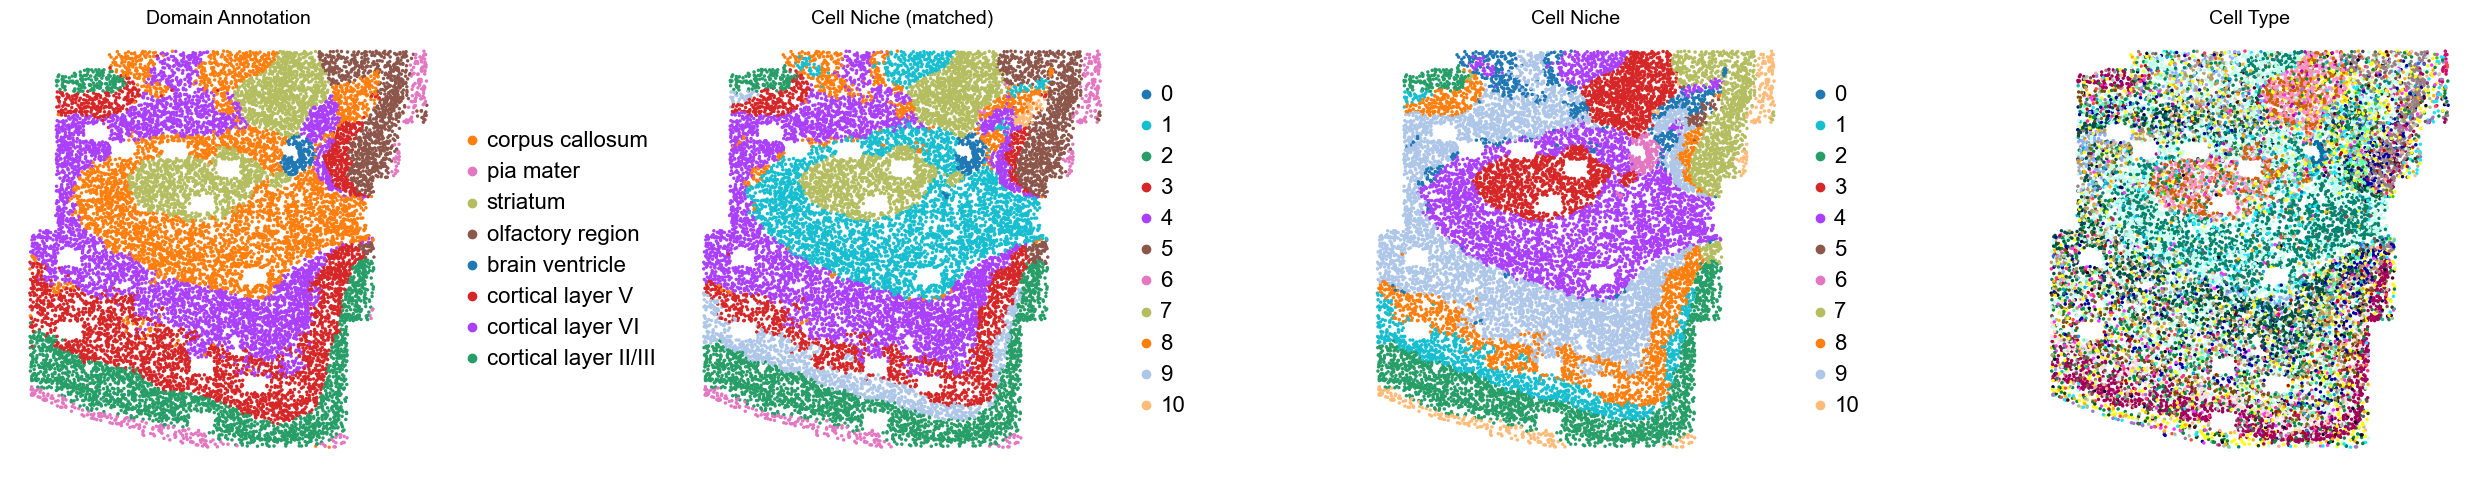
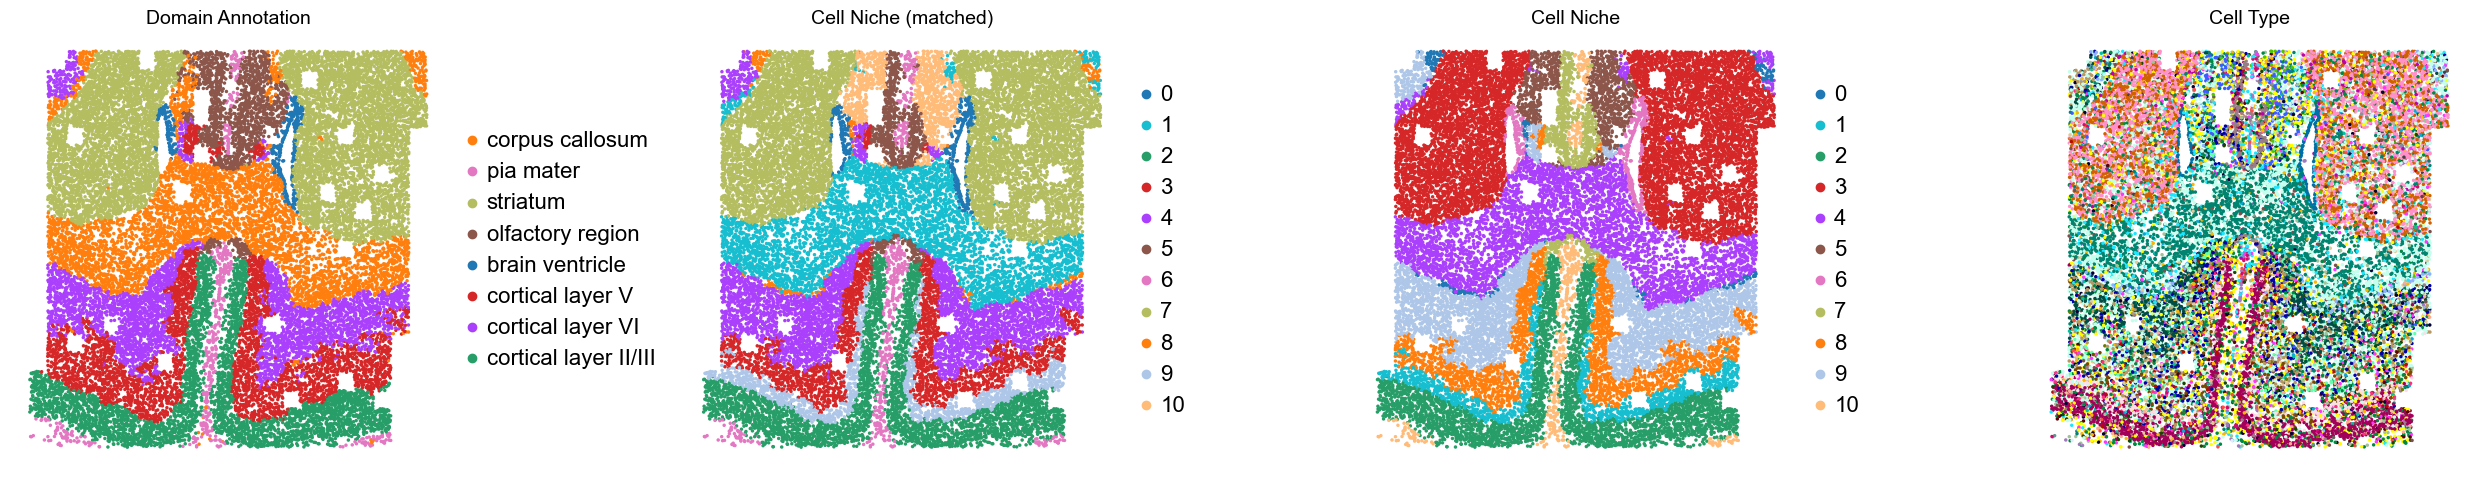
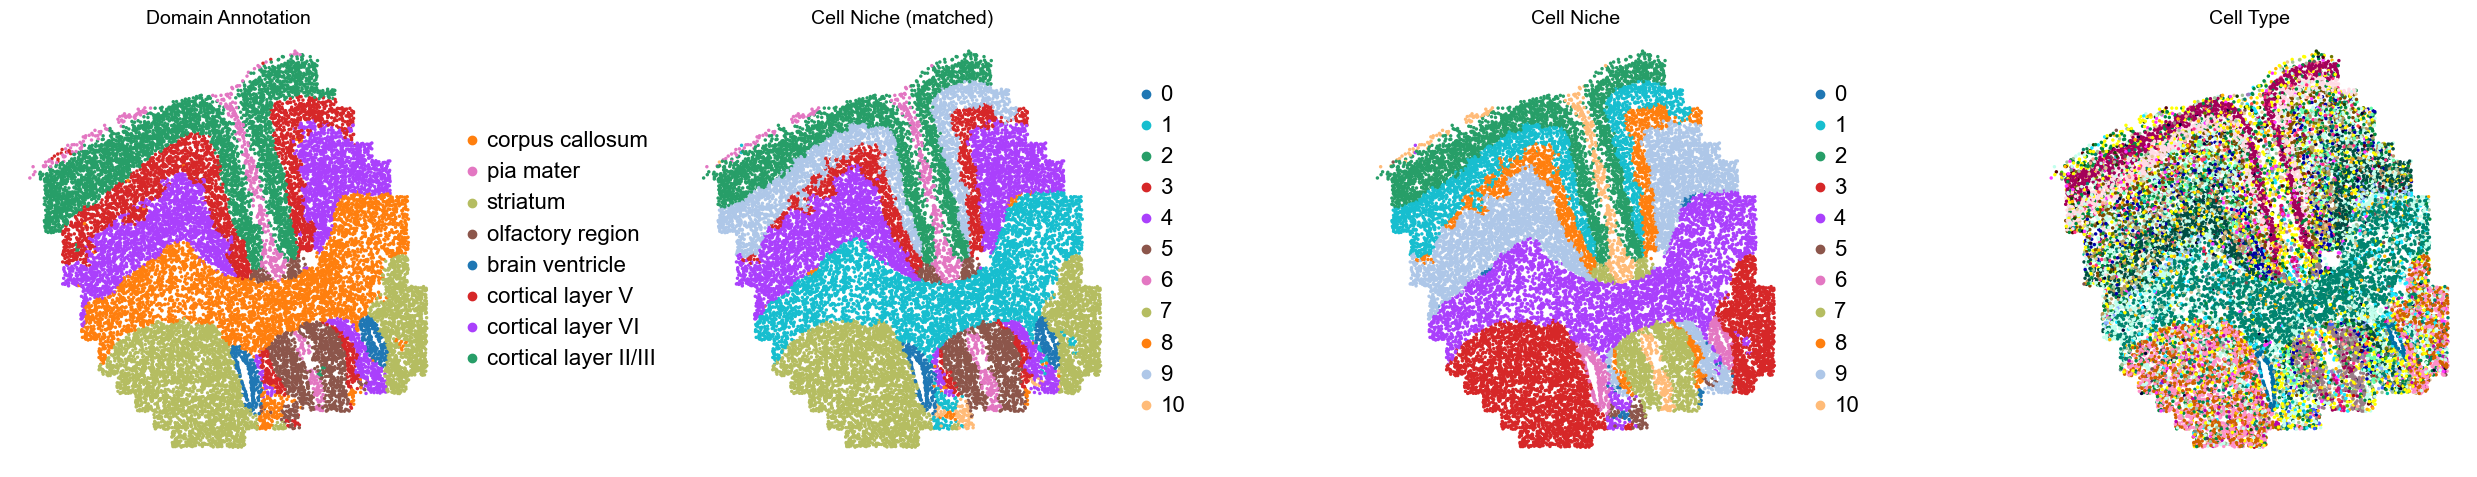
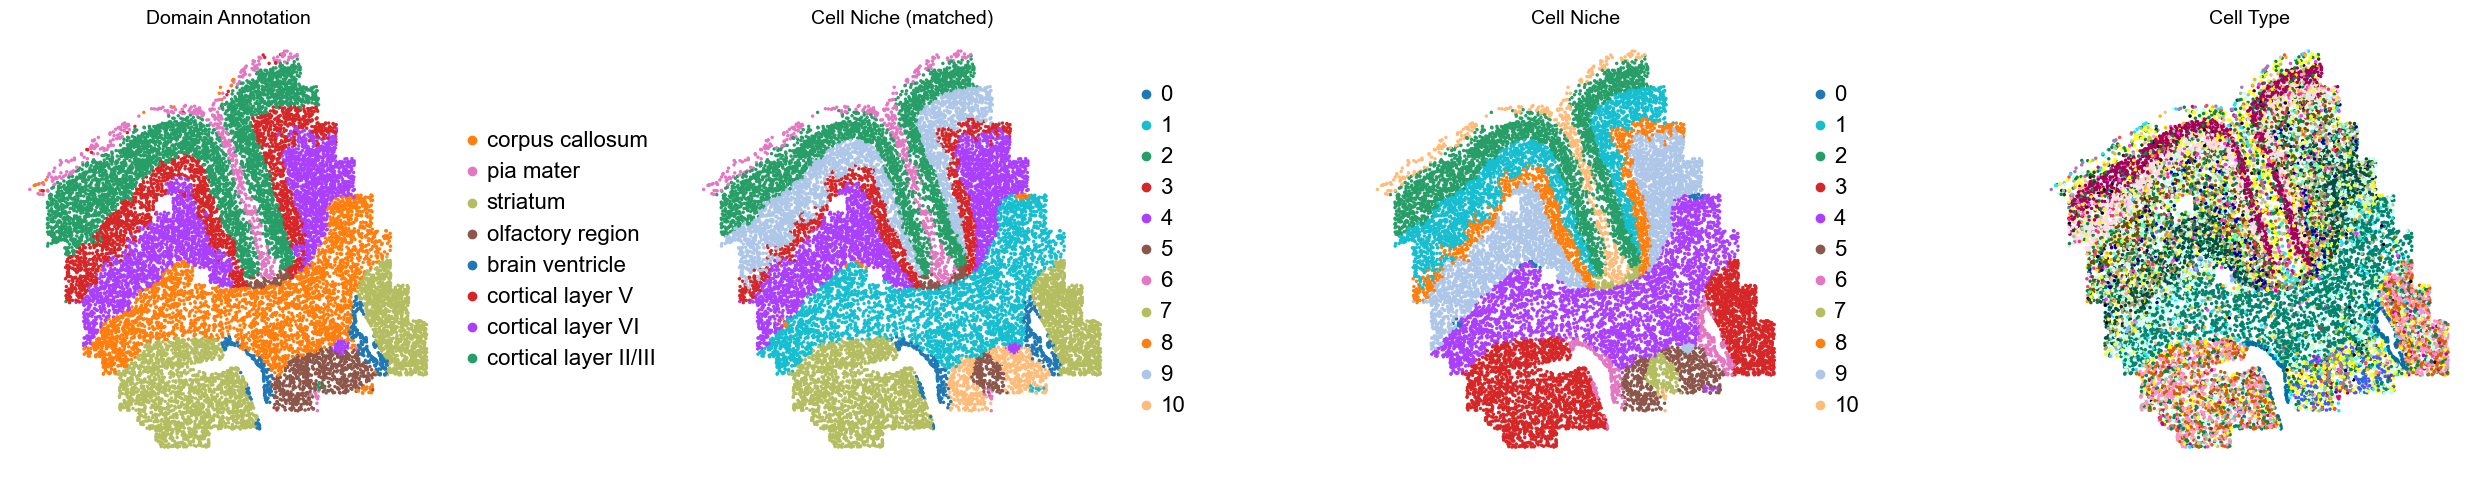
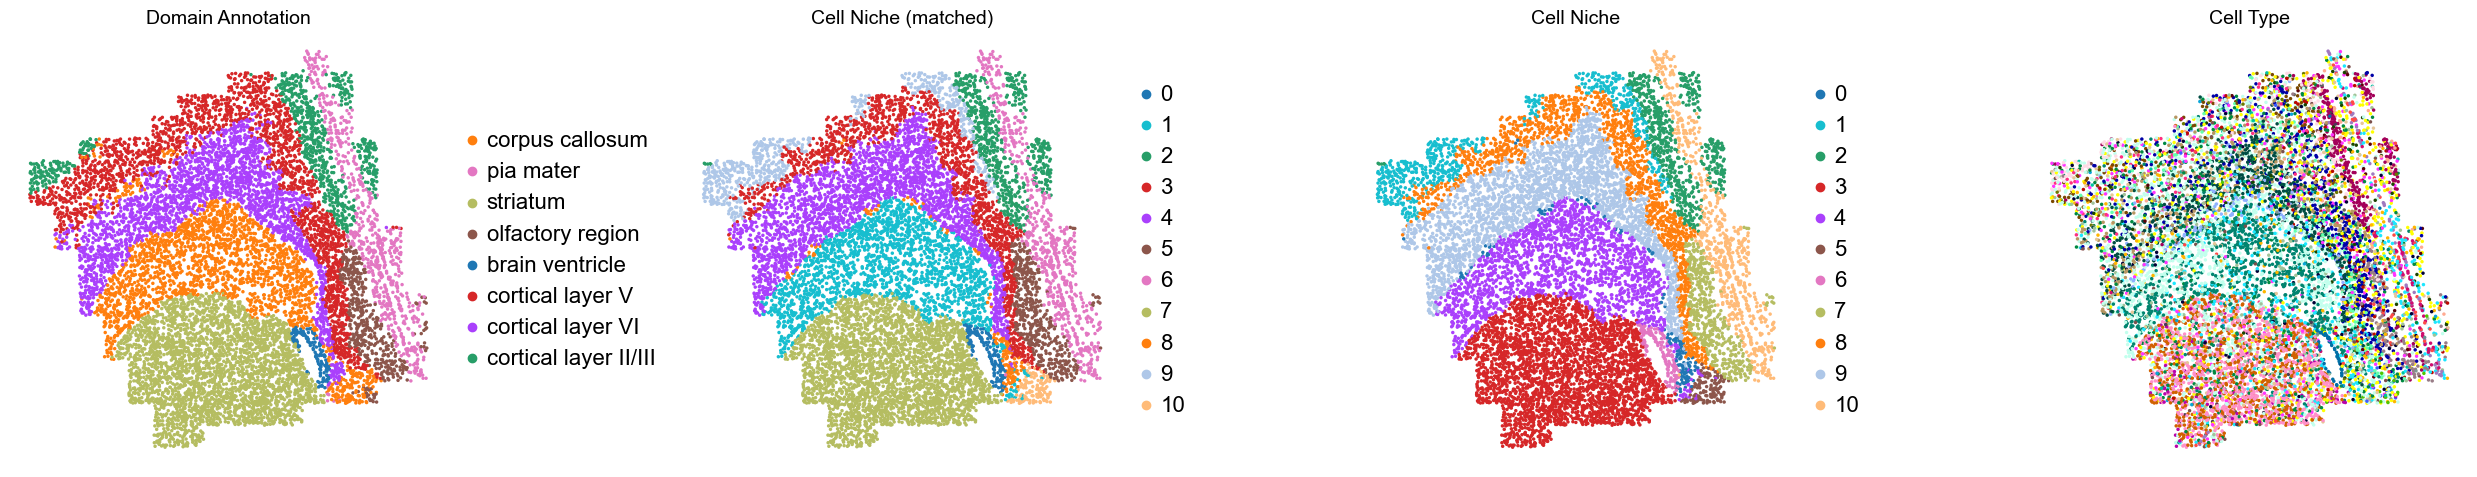
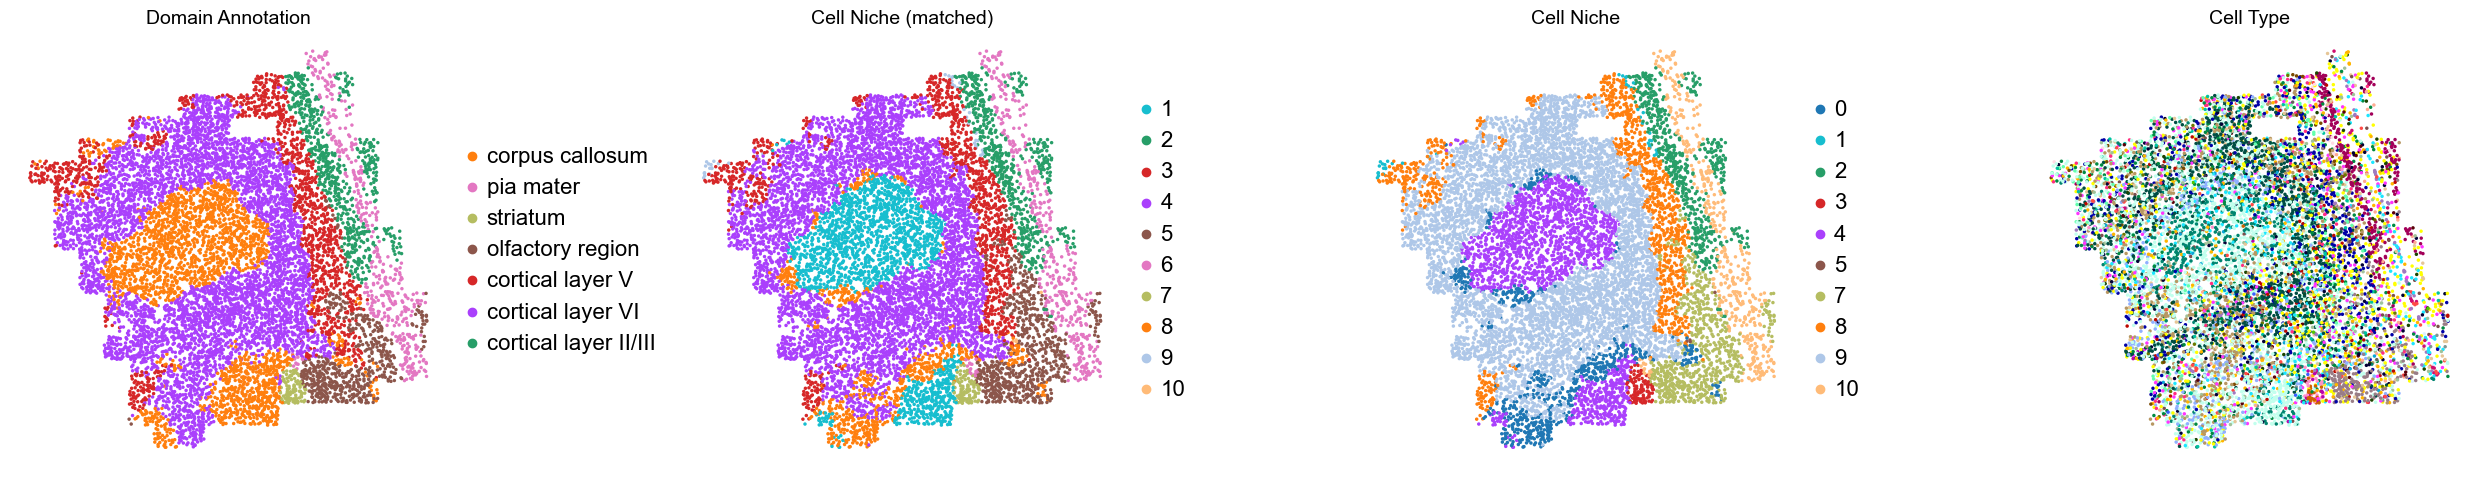
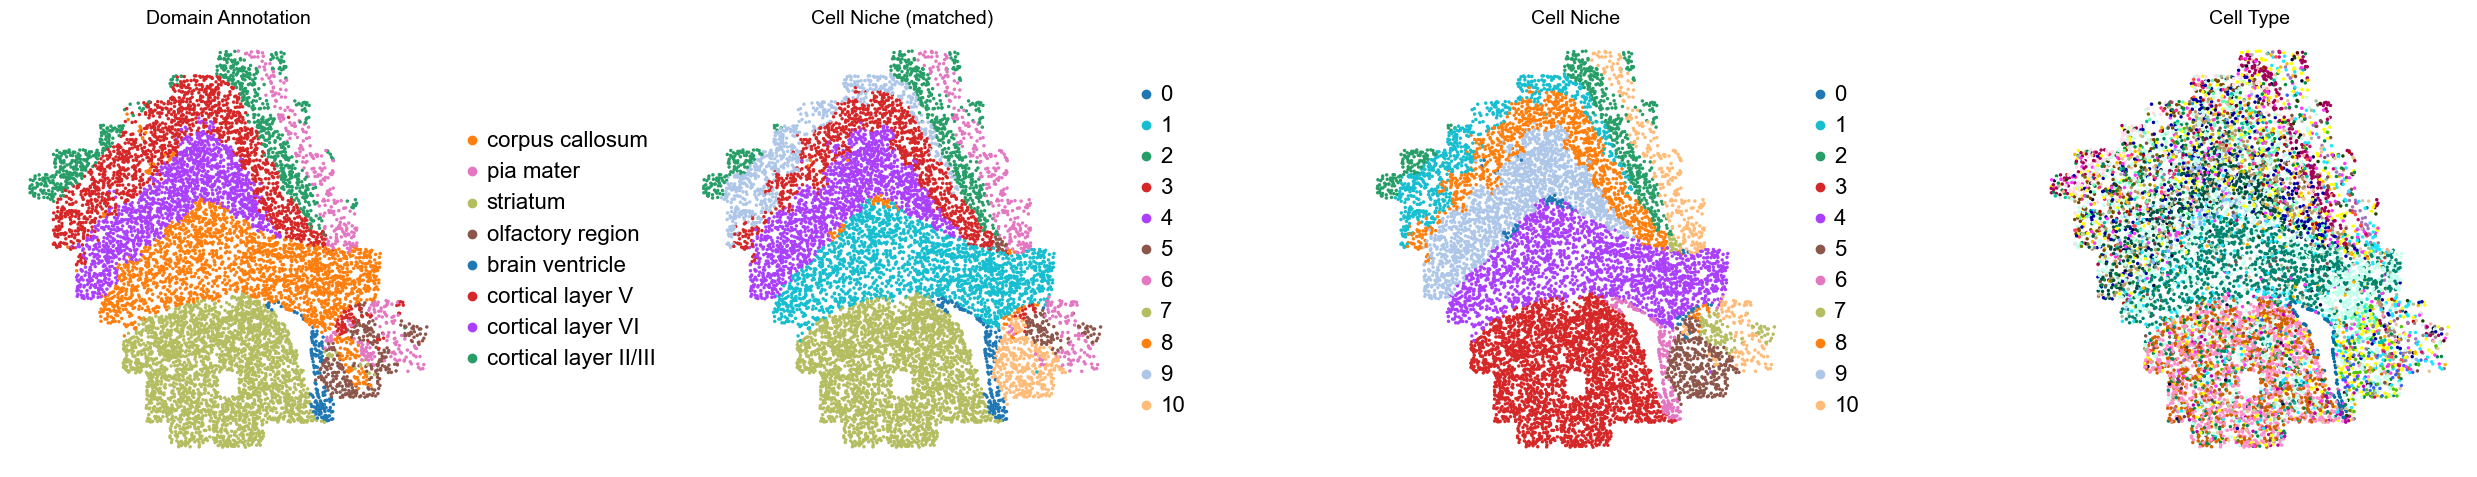
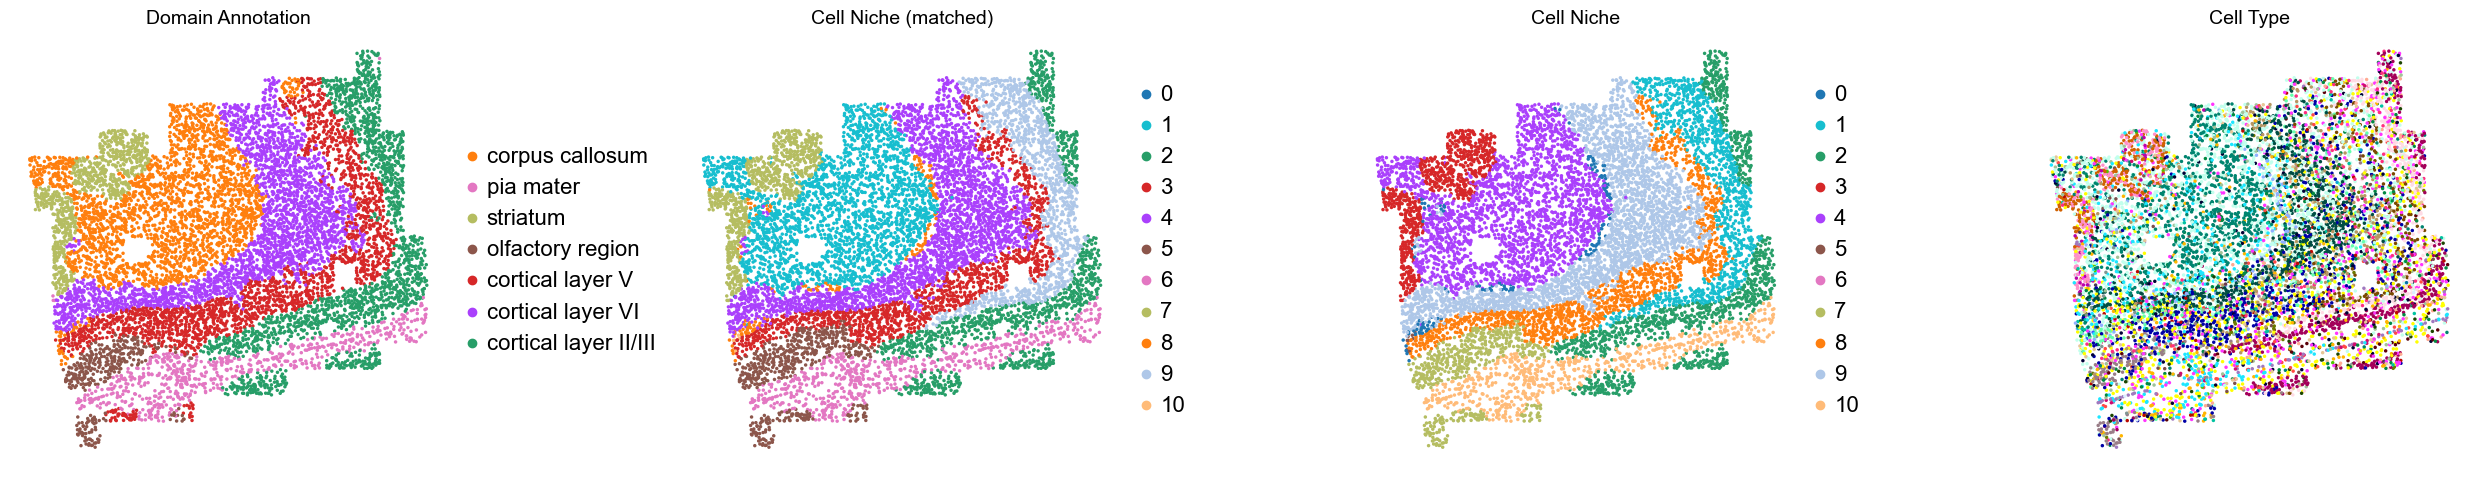
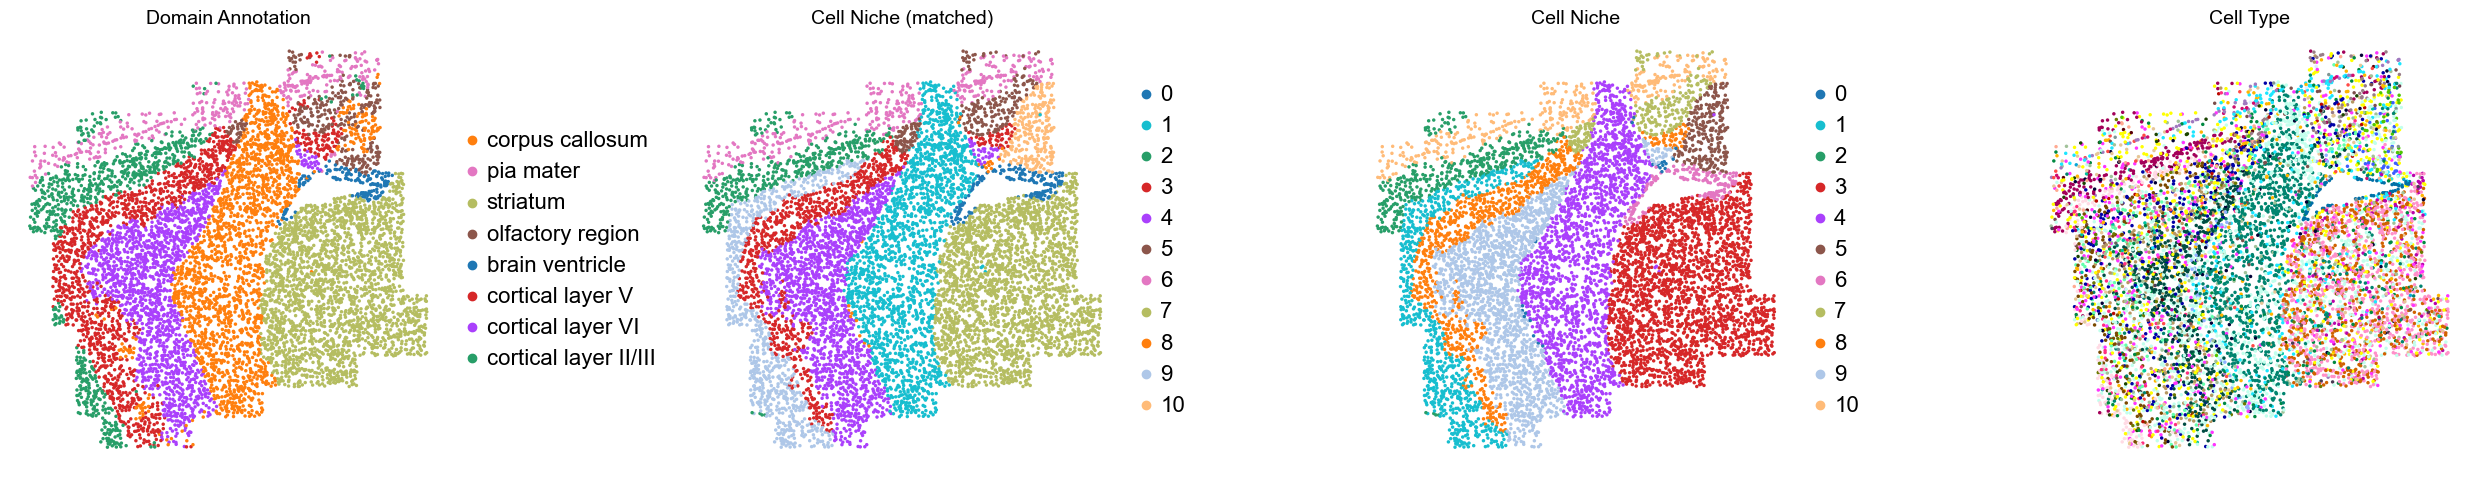
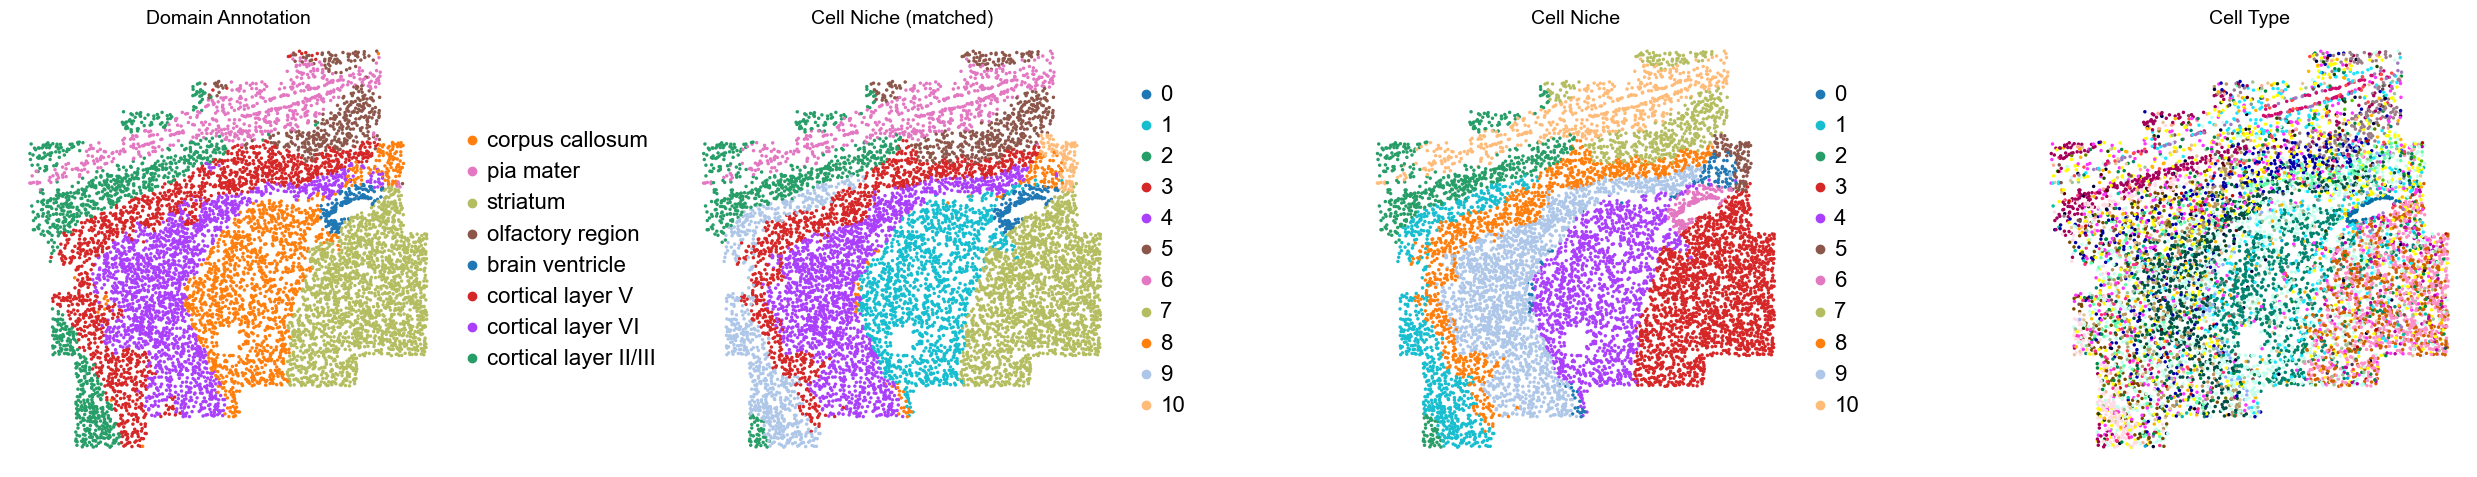
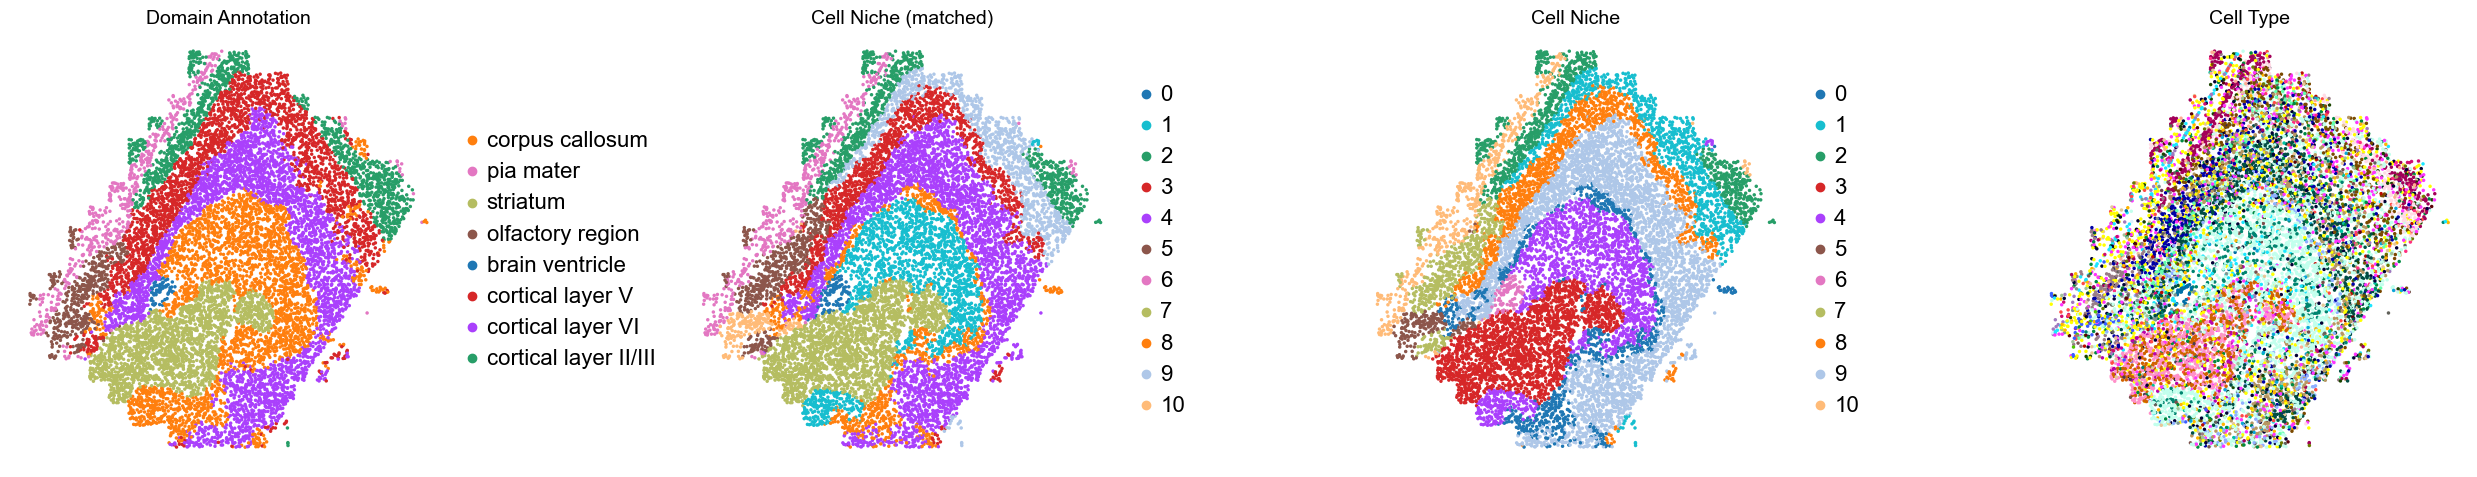
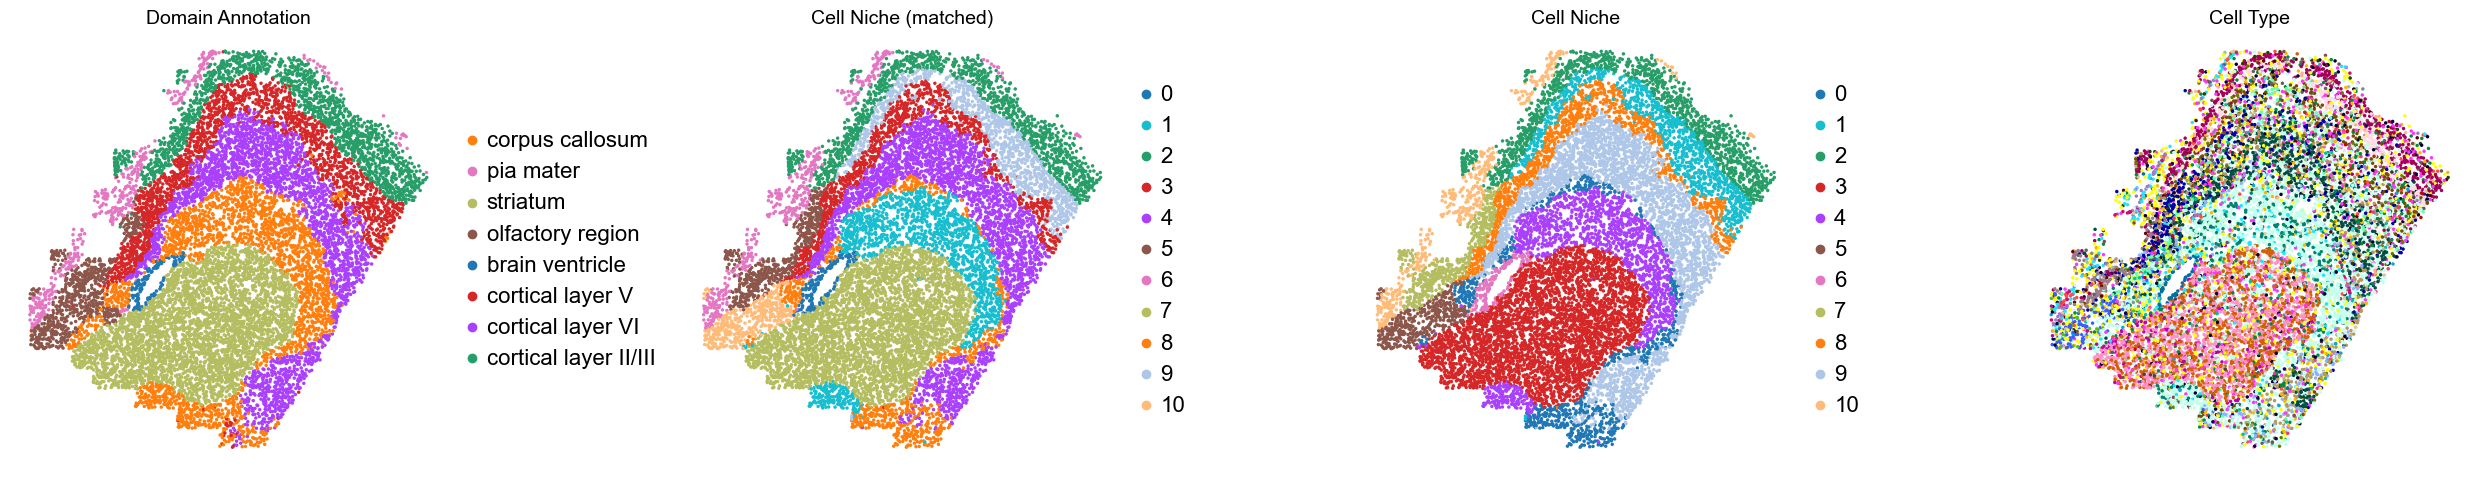
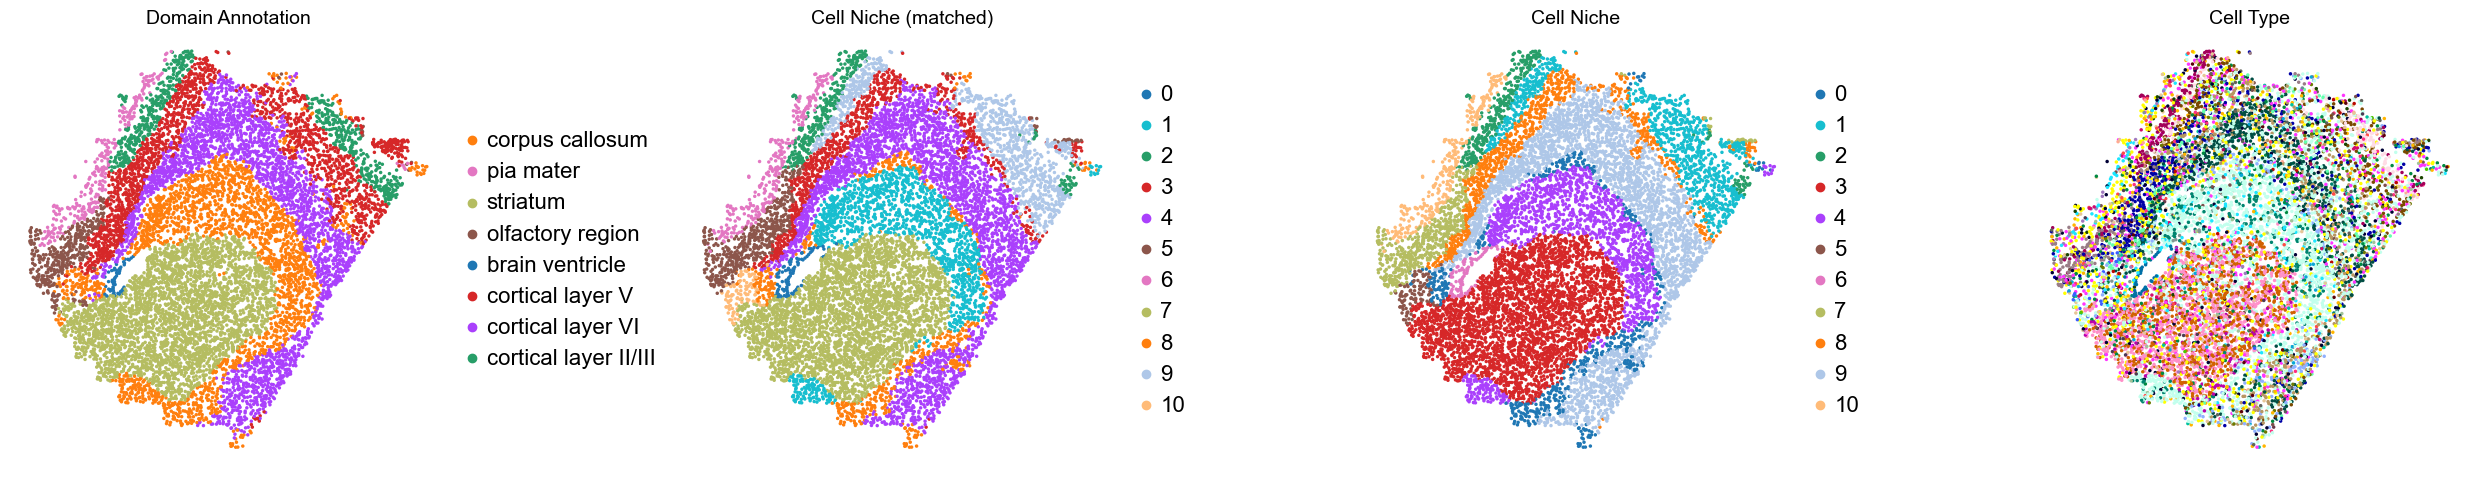
[8]:
for i in range(len(slice_name_list)):

    print(slice_name_list[i])
    adata = adata_concat[adata_concat.obs['slice_name'] == slice_name_list[i]].copy()

    fig, axes = plt.subplots(1, 4, figsize=(25, 5))

    sc.pl.embedding(adata, basis='spatial', palette=domain_color_dict, color='domain_annotation',
                    ax=axes[0], s=25, show=False, frameon=False, title='Domain Annotation', legend_fontsize=16)

    sc.pl.embedding(adata, basis='spatial', palette=niche_color_dict, color='matched_cluster',
                    ax=axes[1], s=25, show=False, frameon=False, title='Cell Niche (matched)', legend_fontsize=16)

    sc.pl.embedding(adata, basis='spatial', palette=niche_color_dict, color='niche_label',
                    ax=axes[2], s=25, show=False, frameon=False, title='Cell Niche', legend_fontsize=16)

    sc.pl.embedding(adata, basis='spatial', palette=ct_color_dict, color='celltype_43',
                    ax=axes[3], s=25, show=False, frameon=False, title='Cell Type', legend_loc=None)

    plt.tight_layout()
    plt.show()
Donor1_Slice0_4wk
Donor4_Slice0_4wk
Donor4_Slice1_4wk
Donor4_Slice2_4wk
Donor7_Slice0_4wk
Donor7_Slice1_4wk
Donor7_Slice2_4wk
Donor8_Slice0_4wk
Donor8_Slice1_4wk
Donor8_Slice2_4wk
Donor10_Slice0_24wk
Donor10_Slice1_24wk
Donor10_Slice2_24wk
Donor11_Slice0_24wk
Donor11_Slice1_24wk
Donor11_Slice2_24wk
Donor12_Slice0_24wk
Donor12_Slice1_24wk
Donor2_Slice0_90wk
Donor2_Slice1_90wk
Donor3_Slice0_90wk
Donor3_Slice1_90wk
Donor5_Slice0_90wk
Donor5_Slice1_90wk
Donor5_Slice2_90wk
Donor6_Slice0_90wk
Donor6_Slice1_90wk
Donor6_Slice2_90wk
Donor9_Slice0_90wk
Donor9_Slice1_90wk
Donor9_Slice2_90wk
[9]:
mapping_df = pd.DataFrame({"matched_cluster": adata_concat.obs["matched_cluster"].values, "niche_label": adata_concat.obs["niche_label"].values})
mapping = mapping_df.groupby("matched_cluster")["niche_label"].agg(lambda x: x.mode().iloc[0]).to_dict()
mapping
[9]:
{'0': '6',
 '1': '4',
 '10': '5',
 '2': '2',
 '3': '8',
 '4': '9',
 '5': '7',
 '6': '10',
 '7': '3',
 '8': '0',
 '9': '1'}
[10]:
perm = np.asarray([mapping[i] for i in adata_concat.uns['niche_label_summary']], dtype=int)

niche_labels = adata_concat.uns['niche_label_summary'].copy()
ct_labels = sorted(set(adata_concat.obs['celltype_43']))
niche_dist = adata_concat.uns['niche_dist'].toarray()[perm].copy()
cell_count_niche = adata_concat.uns['niche_cell_count'][perm].copy()
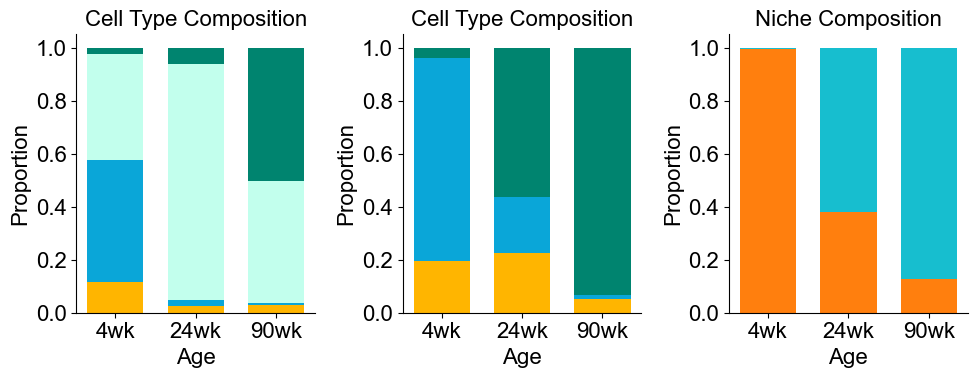
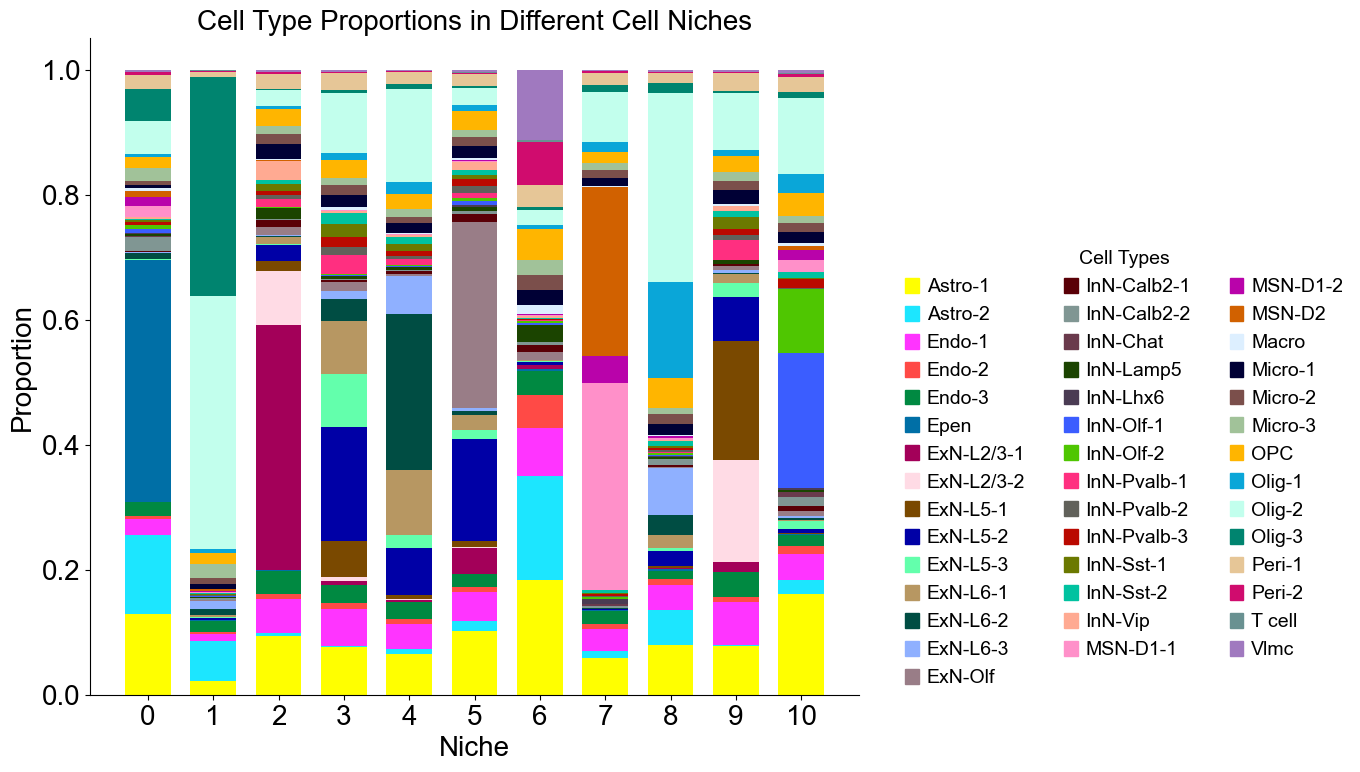
Cell type composition
[11]:
# niche_labels = adata_concat_new.uns['niche_label_summary'].copy()
# ct_labels = sorted(set(adata_concat_new.obs['celltype_43']))
# niche_dist = adata_concat_new.uns['niche_dist'].toarray()[perm].copy()
# cell_count_niche = adata_concat_new.uns['niche_cell_count'][perm].copy()

fig, ax = plt.subplots(figsize=(14, 8))
bar_width = 0.7
n_niches, n_cell_types = niche_dist.shape

x = np.arange(n_niches)

for j in range(n_cell_types):
    bottom = np.sum(niche_dist[:, :j], axis=1)
    ax.bar(x,
           niche_dist[:, j],
           bottom=bottom,
           width=bar_width,
           color=ct_color_dict[ct_labels[j]],
           label=ct_labels[j])

ax.set_ylabel('Proportion', fontsize=20)
ax.set_xlabel('Niche', fontsize=20)
ax.set_xticks(x)
ax.set_xticklabels(niche_labels, rotation=0, ha='center')
ax.tick_params(axis='x', labelsize=20)
ax.tick_params(axis='y', labelsize=20)
ax.spines['top'].set_visible(False)
ax.spines['right'].set_visible(False)
ax.grid(False)

handles = [
    mpatches.Patch(color=color, label=ct)
    for ct, color in zip(celltypes, ct_colors)
]

ax.legend(handles=handles, title='Cell Types', loc=(1.05, 0.0), frameon=False, handleheight=0.8,
          handlelength=0.7, ncol=3, fontsize=14, title_fontsize=14)

plt.title('Cell Type Proportions in Different Cell Niches', fontsize=20)
plt.tight_layout()
plt.show()
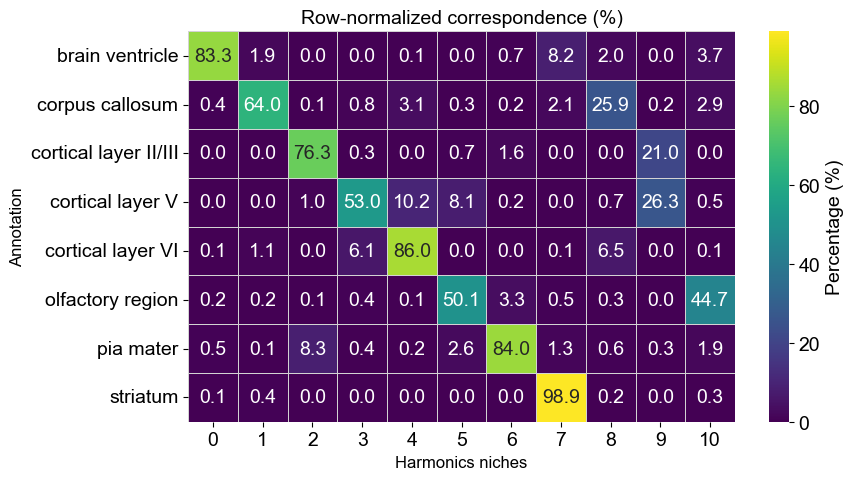
Correspondence between annotation and Harmonics results
[12]:
df = adata_concat.obs[['domain_annotation', 'matched_cluster']].copy()
df['domain_annotation'] = df['domain_annotation'].astype(str)
df['matched_cluster'] = df['matched_cluster'].astype(int)

ct = pd.crosstab(df['domain_annotation'], df['matched_cluster'])

ct_ratio = ct.div(ct.sum(axis=1), axis=0) * 100

fig, ax = plt.subplots(1, 1, figsize=(9, 5))
sns.heatmap(
    ct_ratio,
    cmap="viridis",
    annot=True,
    fmt=".1f",
    linewidths=0.5,
    linecolor="lightgray",
    cbar_kws={"label": "Percentage (%)"}
)

ax.set_xlabel("Harmonics niches", fontsize=12)
ax.set_ylabel("Annotation", fontsize=12)
ax.set_title("Row-normalized correspondence (%)", fontsize=14)
ax.grid(False)
plt.tight_layout()
plt.show()
Cell type enrichment analysis
[13]:
ct_df = ct_enrichment_test(niche_dist,
                           cell_count_niche,
                           adata_concat.uns['idx2ct'],
                           niche_labels,
                           method='fisher',
                           alpha=0.05,
                           fdr_method='fdr_by',
                           log2fc_threshold=1,
                           prop_threshold=0.01,
                           verbose=True,
                           )
ct_df.head()
11 niches and 43 cell types in total.
[13]:
| niche_idx | niche | celltype_idx | celltype | oddsratio | p-value | q-value | log2fc | prop | enrichment | |
|---|---|---|---|---|---|---|---|---|---|---|
| 0 | 0 | 0 | 0 | Astro-1 | 1.811693 | 6.405808e-23 | 7.560692e-22 | 0.774898 | 0.129235 | False |
| 1 | 0 | 0 | 1 | Astro-2 | 6.377845 | 4.416798e-151 | 1.126027e-149 | 2.510422 | 0.126441 | True |
| 2 | 0 | 0 | 2 | Endo-1 | 0.559142 | 1.741093e-07 | 1.617630e-06 | -0.810778 | 0.024799 | False |
| 3 | 0 | 0 | 3 | Endo-2 | 0.489848 | 4.266724e-03 | 3.495396e-02 | -1.022265 | 0.004890 | False |
| 4 | 0 | 0 | 4 | Endo-3 | 0.868753 | 2.885846e-01 | 1.000000e+00 | -0.198042 | 0.022703 | False |
[14]:
matrix_df = pd.DataFrame(
data=niche_dist,
index=niche_labels,
columns=ct_labels,
)
cn_dist_count = niche_dist * cell_count_niche[:, np.newaxis]
cn_dist_norm = cn_dist_count / np.sum(cn_dist_count, axis=0)
matrix_df_norm = pd.DataFrame(
data=cn_dist_norm,
index=niche_labels,
columns=ct_labels,
)
ct_df['stars'] = ct_df['q-value'].apply(p2stars)
stars_df = pd.DataFrame(
'',
index=matrix_df.index,
columns=matrix_df.columns
)
for _, row in ct_df[ct_df['enrichment']].iterrows():
niche = row['niche']
ct = row['celltype']
if (niche in stars_df.index) and (ct in stars_df.columns):
stars_df.loc[niche, ct] = row['stars']
fig, axes = plt.subplots(1, 1, figsize=(20, 7))
sns_heatmap_0 = sns.heatmap(
matrix_df,
cmap='Blues',
# cbar_kws={'label': 'Cell type proportion'},
linewidths=0.5,
linecolor='gray',
# square=True,
ax=axes
)
for i, niche in enumerate(matrix_df.index):
for j, ct in enumerate(matrix_df.columns):
star = stars_df.iloc[i, j]
if star:
if matrix_df.iloc[i, j] > np.max(matrix_df.values) * 0.7:
color='white'
else:
color='black'
axes.text(j + 0.5, i + 0.6, star, ha='center', va='center', color=color, fontsize=15, fontweight='bold')
n_rows, n_cols = matrix_df.shape
axes.plot([0, n_cols], [n_rows, n_rows], color='gray', linewidth=0.5, clip_on=False)
axes.plot([n_cols, n_cols], [0, n_rows], color='gray', linewidth=0.5, clip_on=False)
axes.set_xticklabels(axes.get_xticklabels(), rotation=90, ha='center', fontsize=20)
axes.set_yticklabels(axes.get_yticklabels(), rotation=0, ha='right', fontsize=20)
axes.set_ylabel('Niche', fontsize=20)
axes.set_xlabel('Cell Type', fontsize=20)
axes.set_title('Cell Type Proportions', fontsize=20)
axes.collections[0].colorbar.ax.yaxis.label.set_size(20)
axes.collections[0].colorbar.ax.tick_params(labelsize=16)
axes.grid(False)
plt.tight_layout()
plt.show()
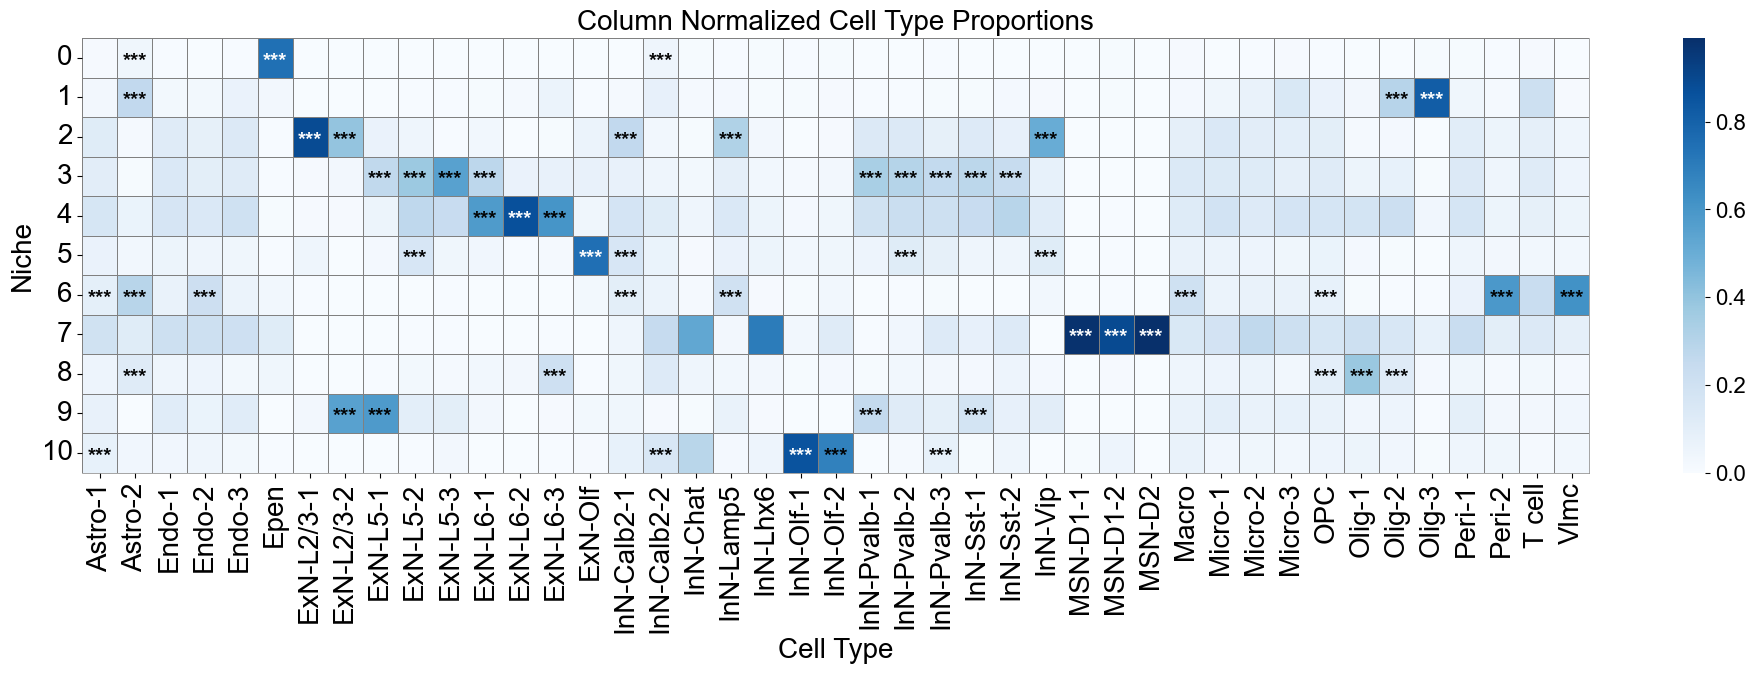
fig, axes = plt.subplots(1, 1, figsize=(20, 7))
sns_heatmap_1 = sns.heatmap(
matrix_df_norm,
cmap='Blues',
# cbar_kws={'label': 'Cell type proportion'},
linewidths=0.5,
linecolor='gray',
# square=True,
ax=axes
)
for i, niche in enumerate(matrix_df.index):
for j, ct in enumerate(matrix_df.columns):
star = stars_df.iloc[i, j]
if star:
if matrix_df_norm.iloc[i, j] > np.max(matrix_df_norm.values) * 0.7:
color='white'
else:
color='black'
axes.text(j + 0.5, i + 0.6, star, ha='center', va='center', color=color, fontsize=15, fontweight='bold')
n_rows, n_cols = matrix_df.shape
axes.plot([0, n_cols], [n_rows, n_rows], color='gray', linewidth=0.5, clip_on=False)
axes.plot([n_cols, n_cols], [0, n_rows], color='gray', linewidth=0.5, clip_on=False)
axes.set_xticklabels(axes.get_xticklabels(), rotation=90, ha='center', fontsize=20)
axes.set_yticklabels(axes.get_yticklabels(), rotation=0, ha='right', fontsize=20)
axes.set_ylabel('Niche', fontsize=20)
axes.set_xlabel('Cell Type', fontsize=20)
axes.set_title('Column Normalized Cell Type Proportions', fontsize=20)
axes.collections[0].colorbar.ax.yaxis.label.set_size(20)
axes.collections[0].colorbar.ax.tick_params(labelsize=16)
axes.grid(False)
plt.tight_layout()
plt.show()
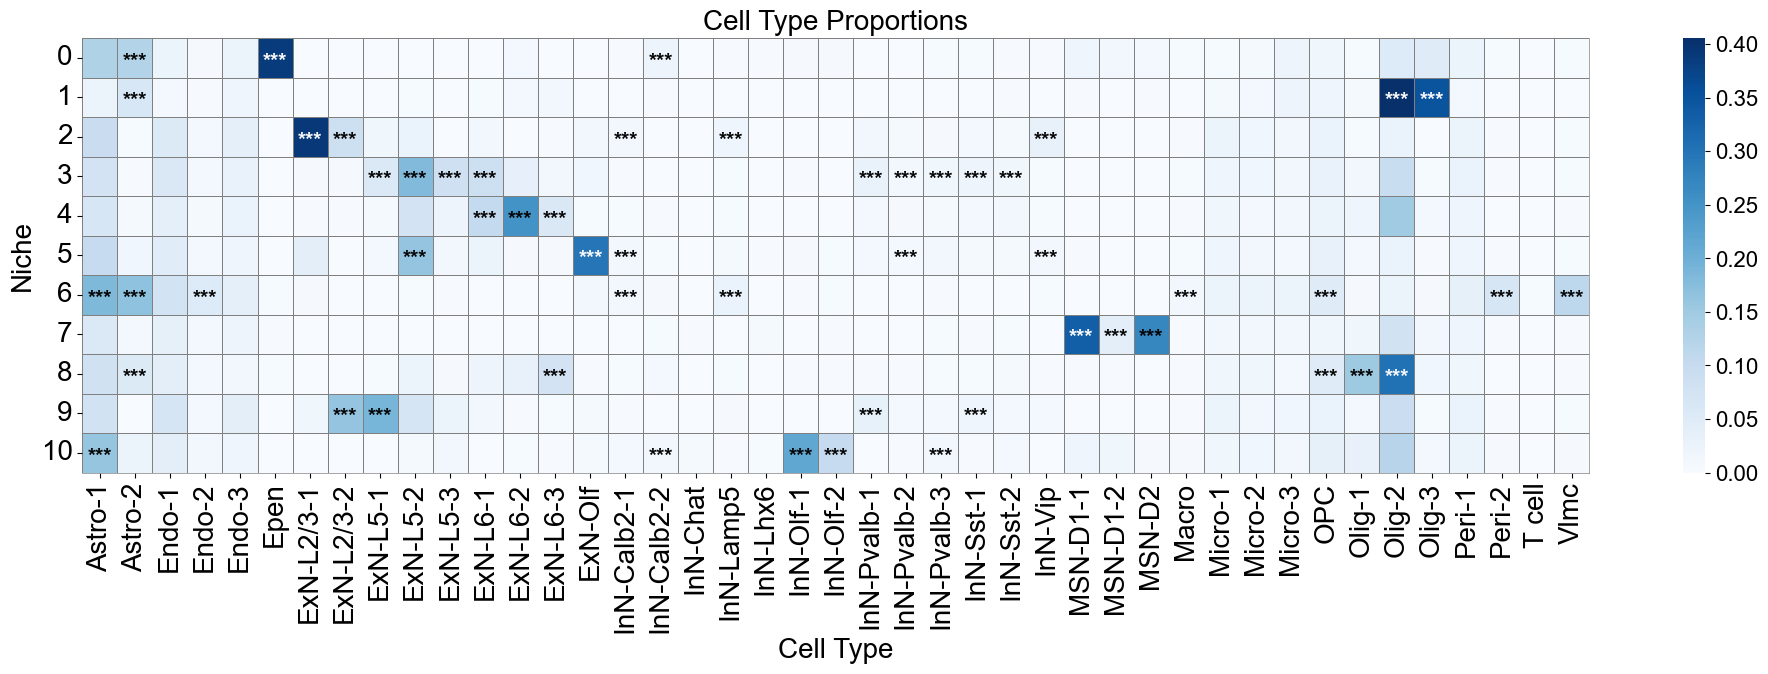
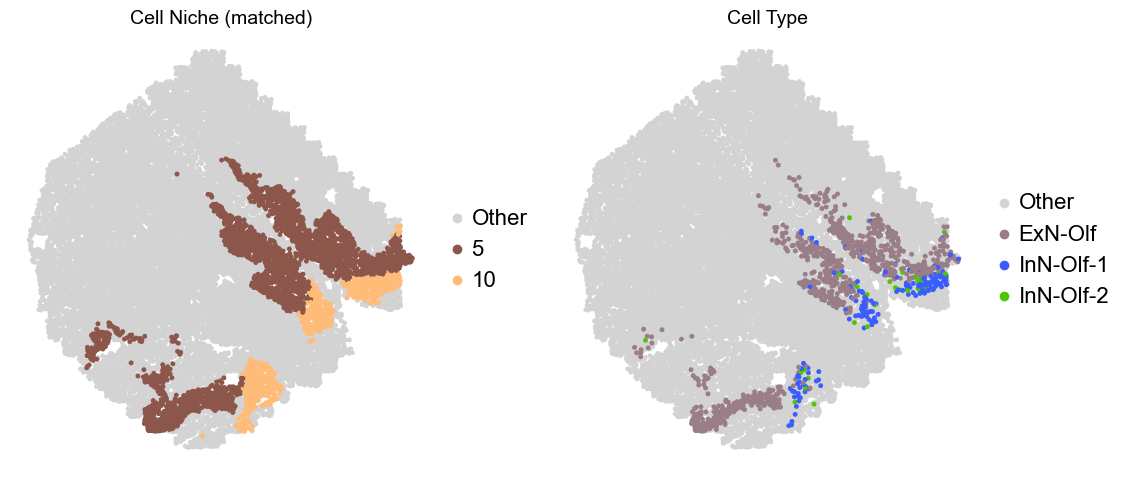
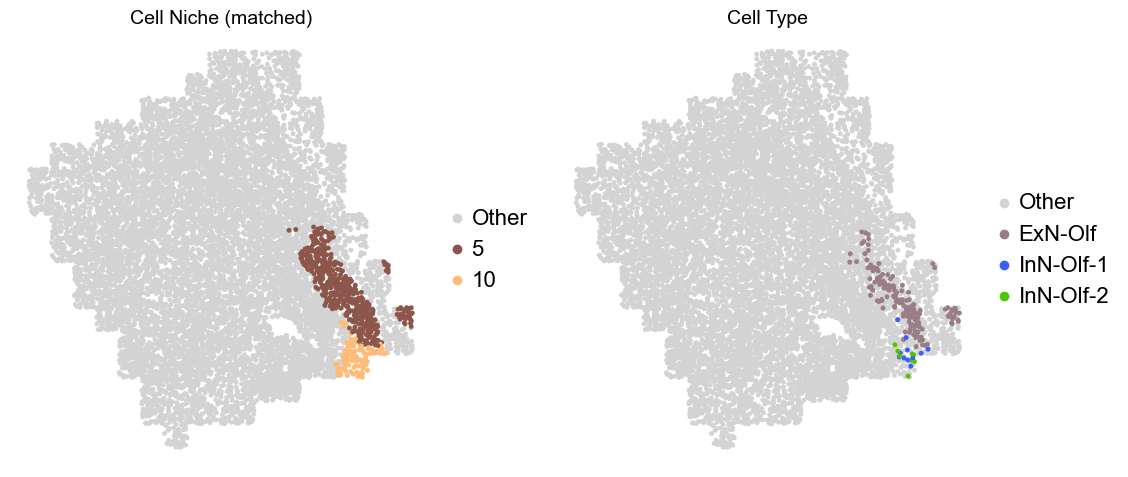
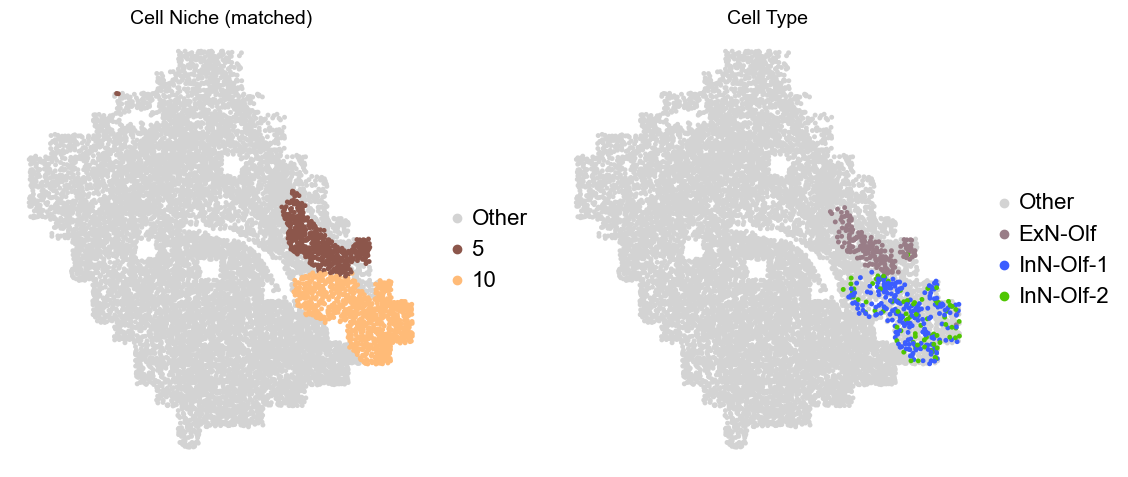
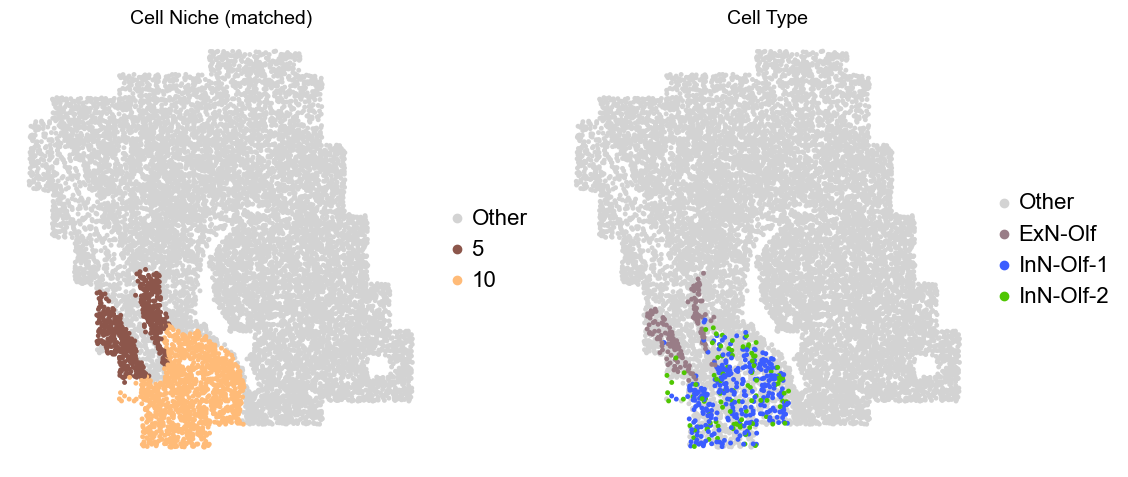
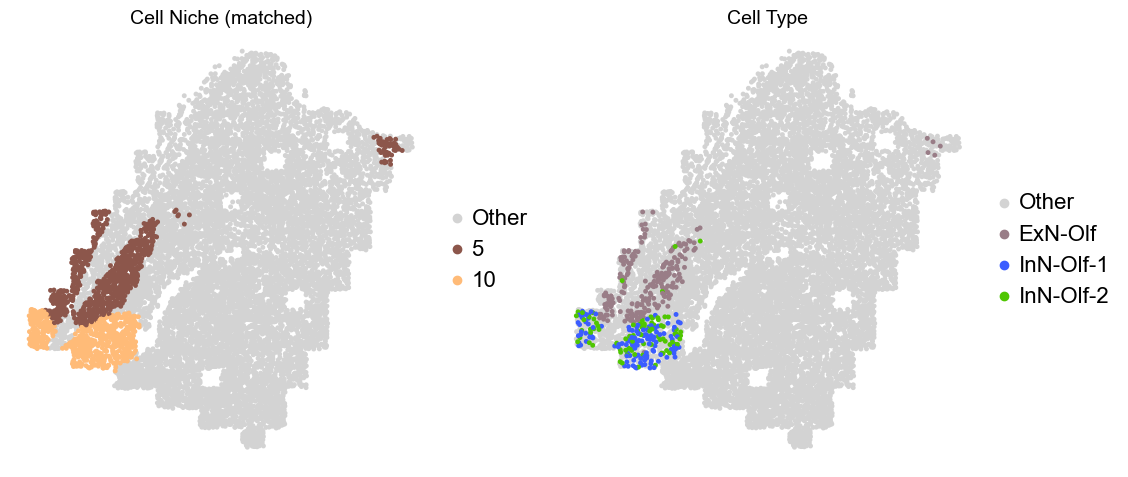
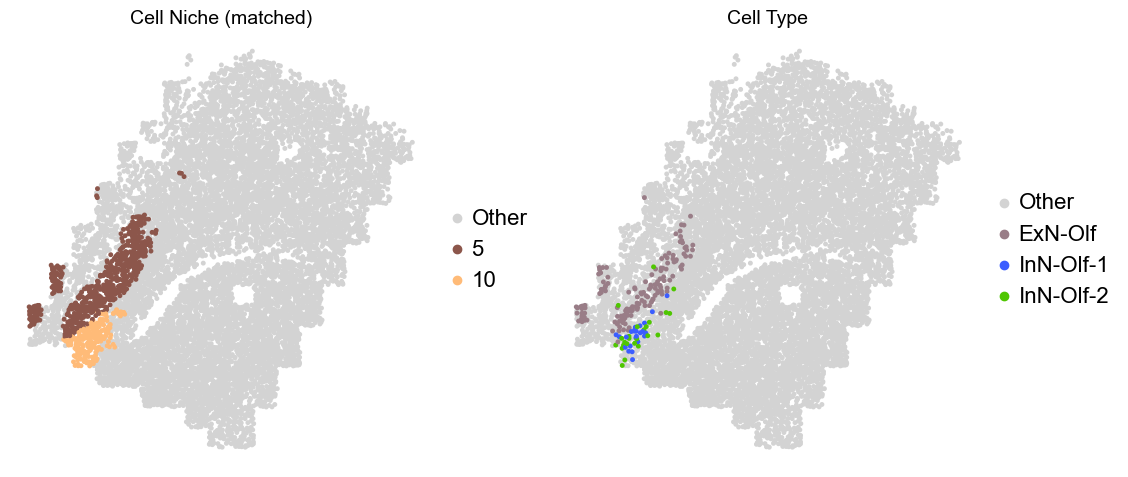
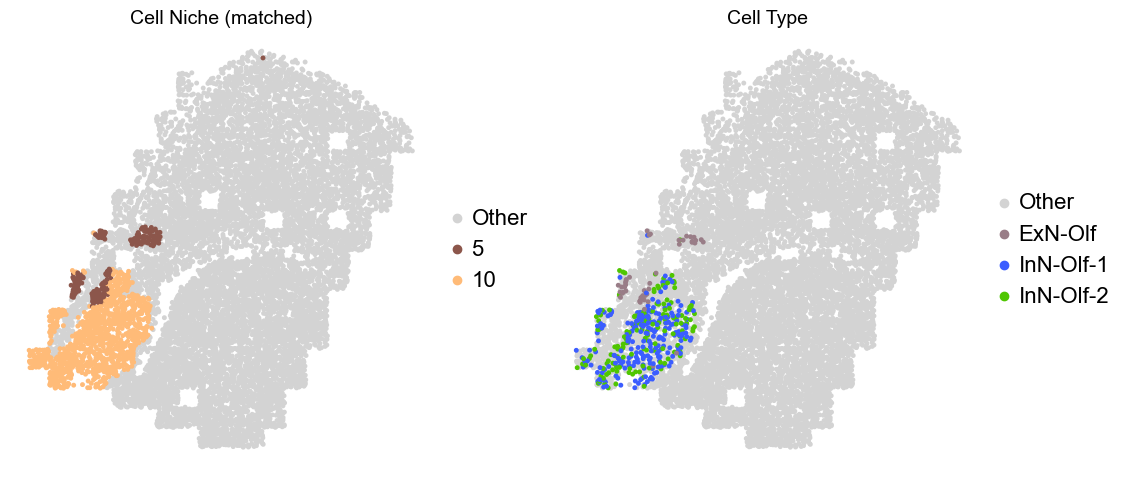
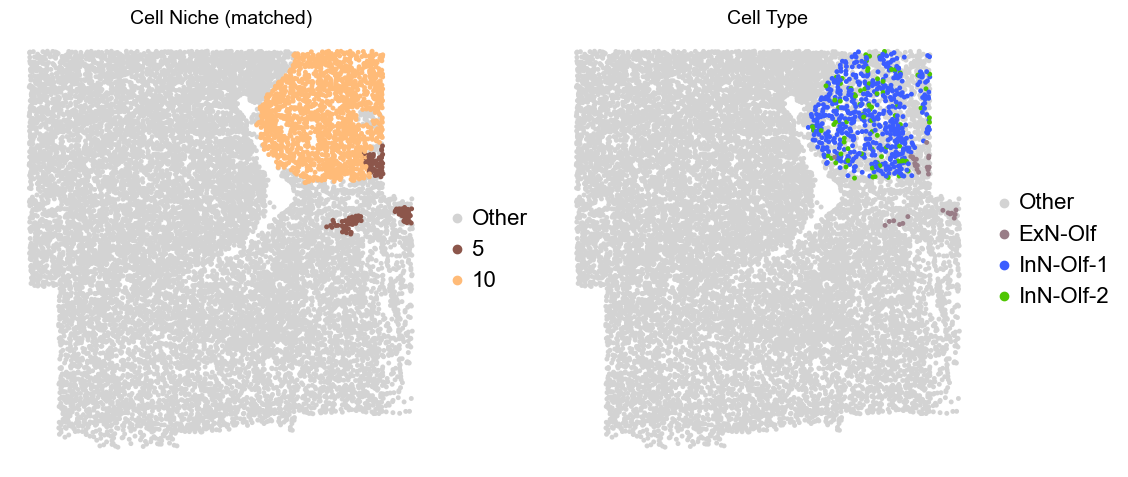
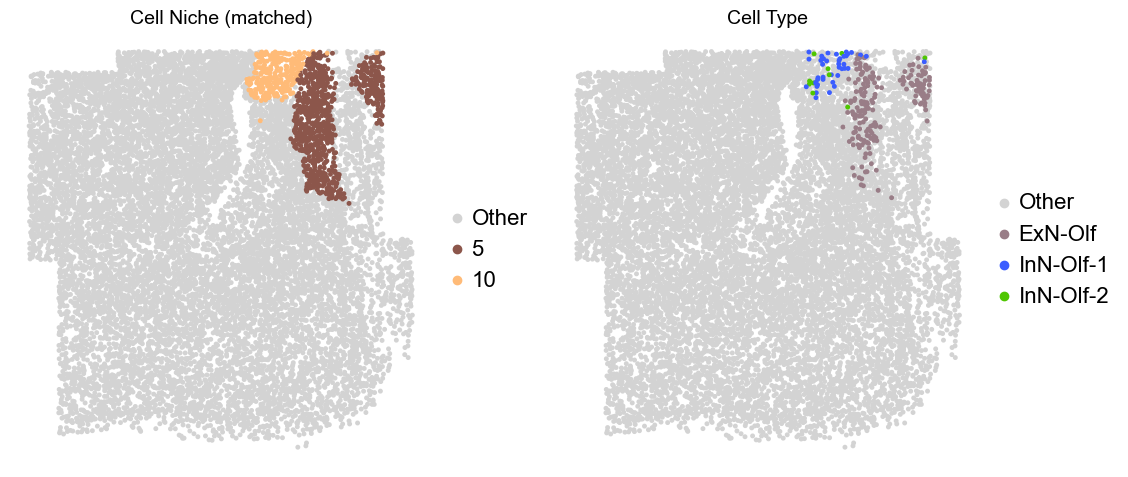
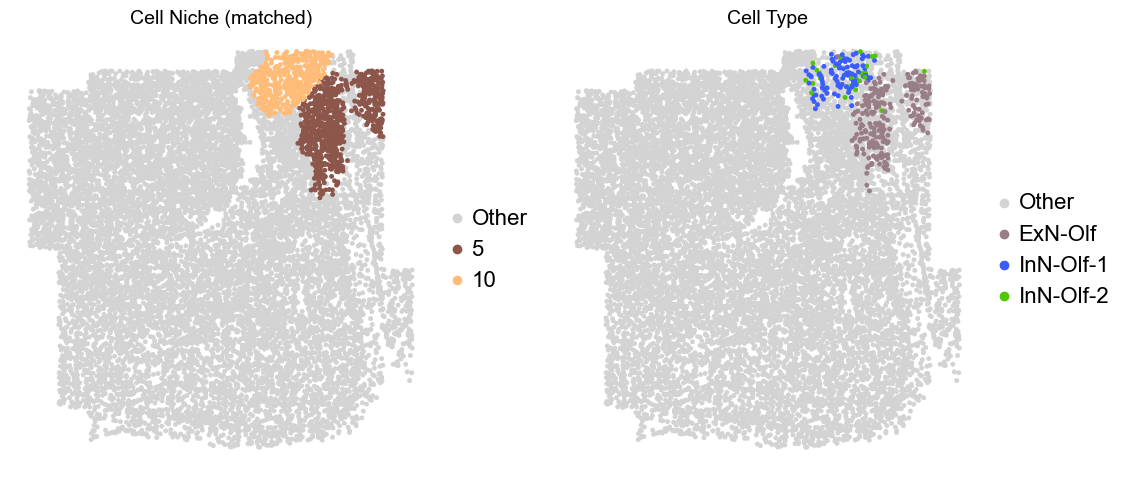
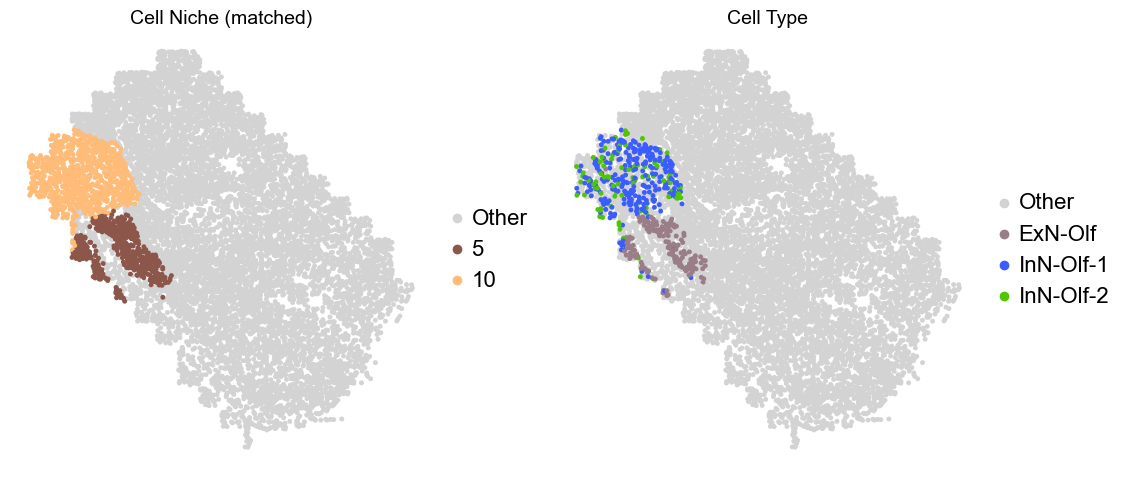
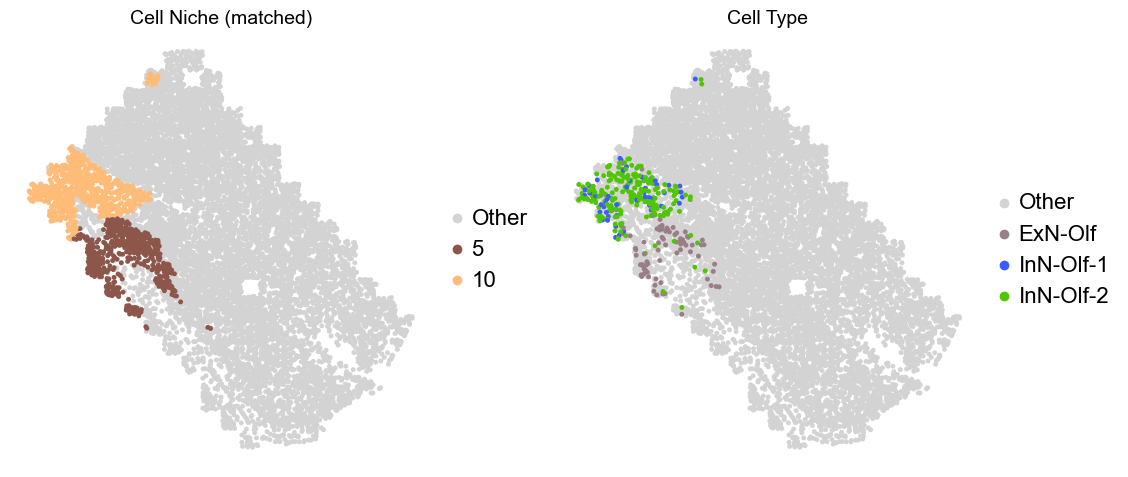
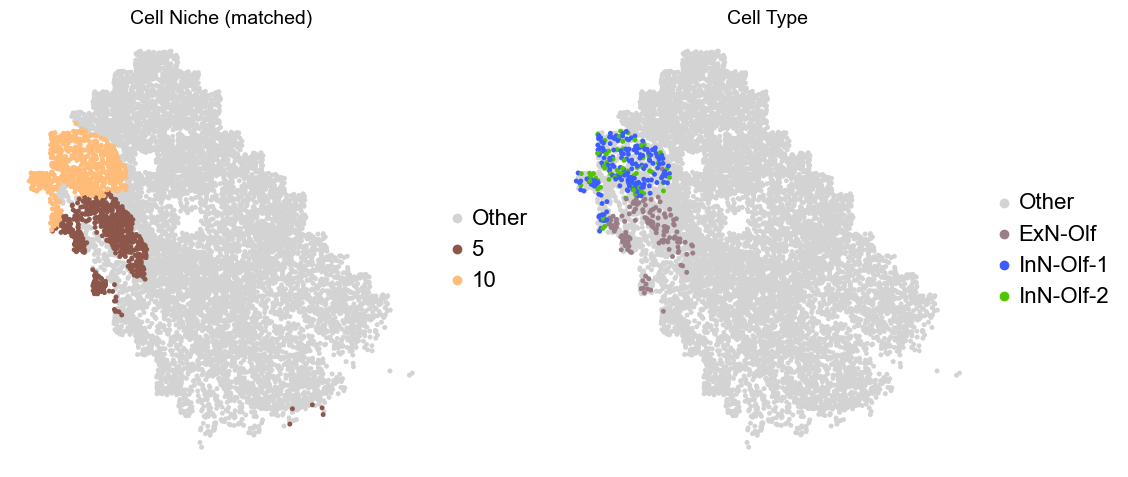
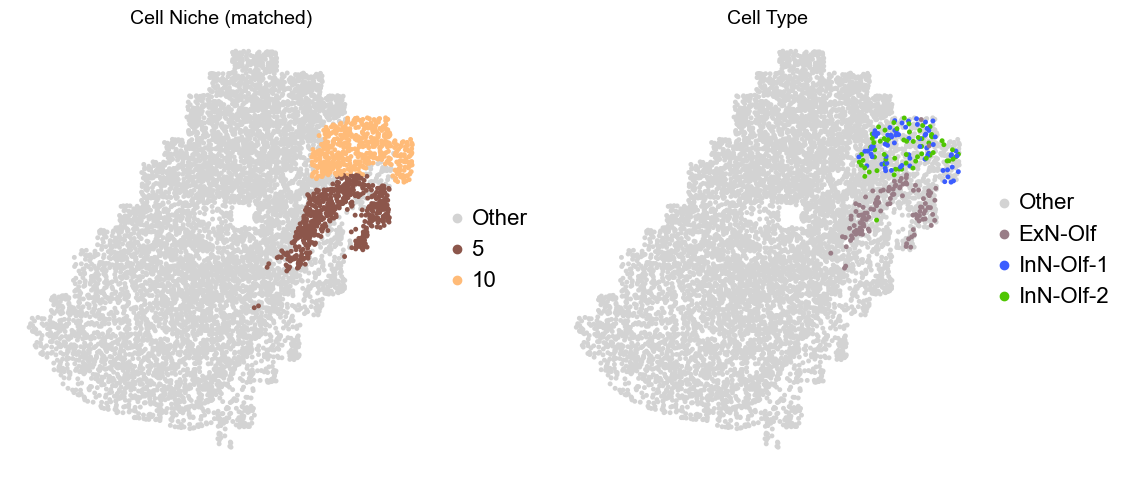
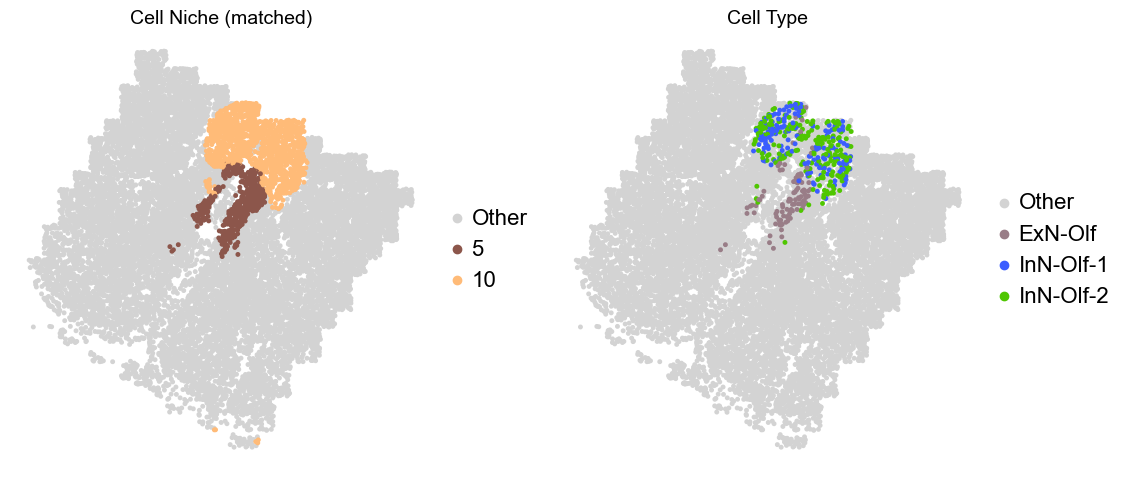
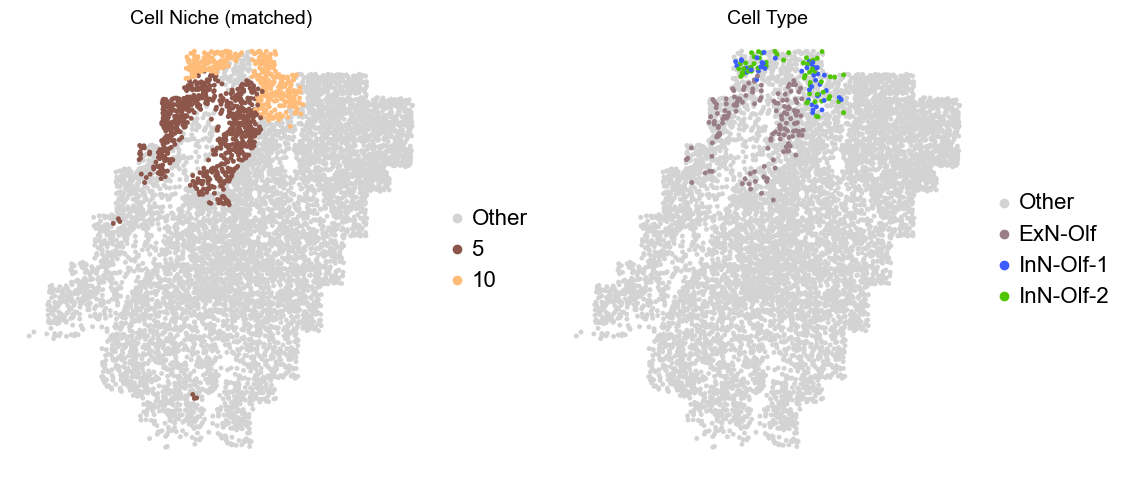
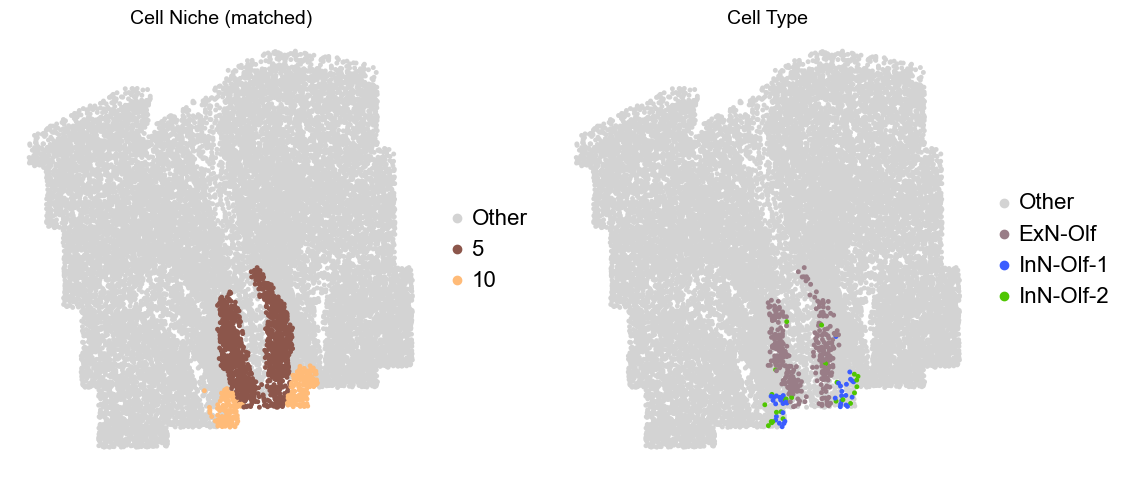
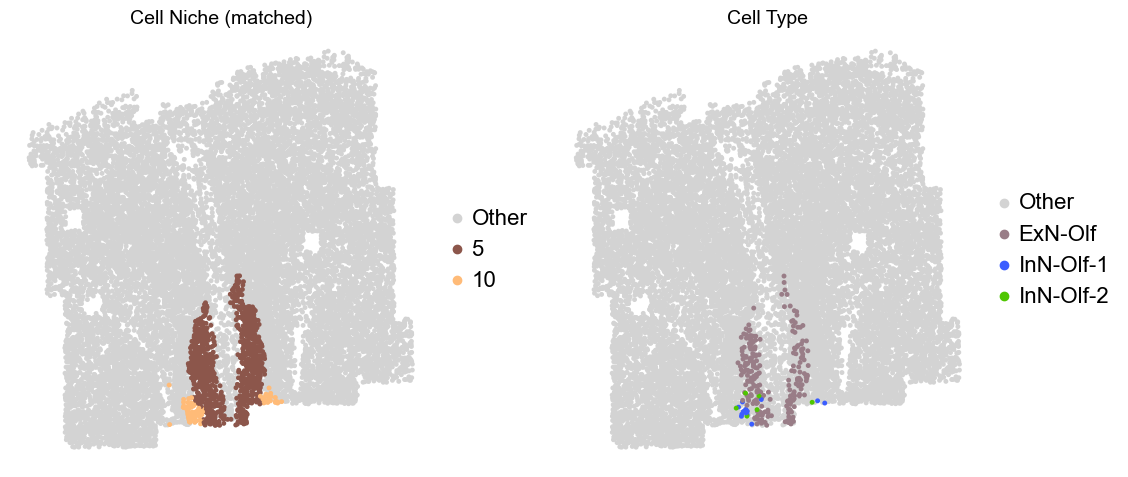
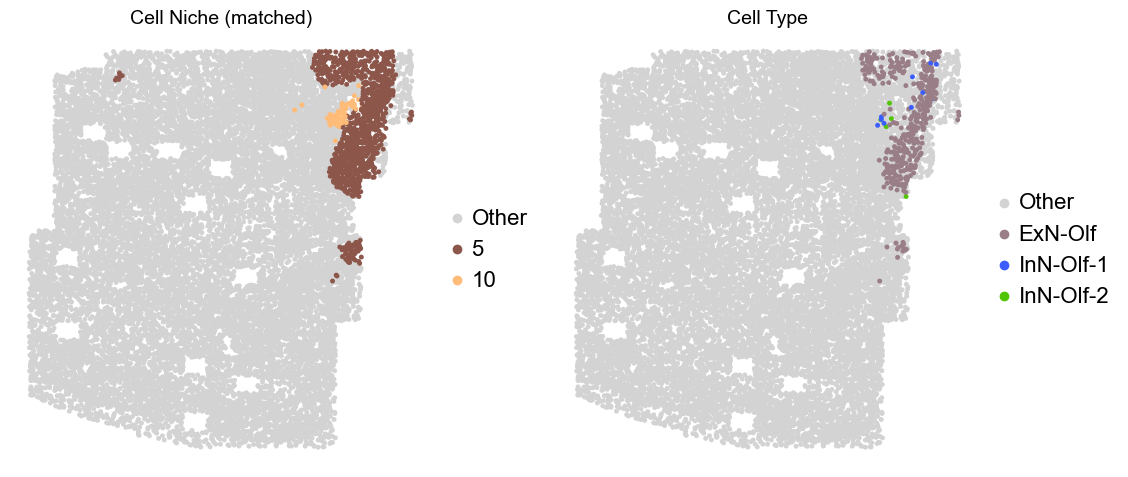
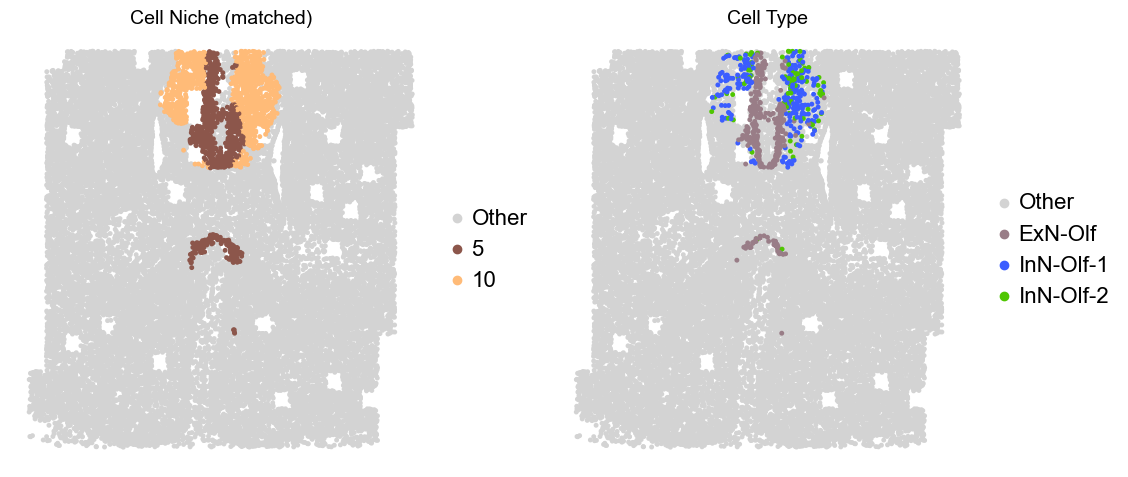
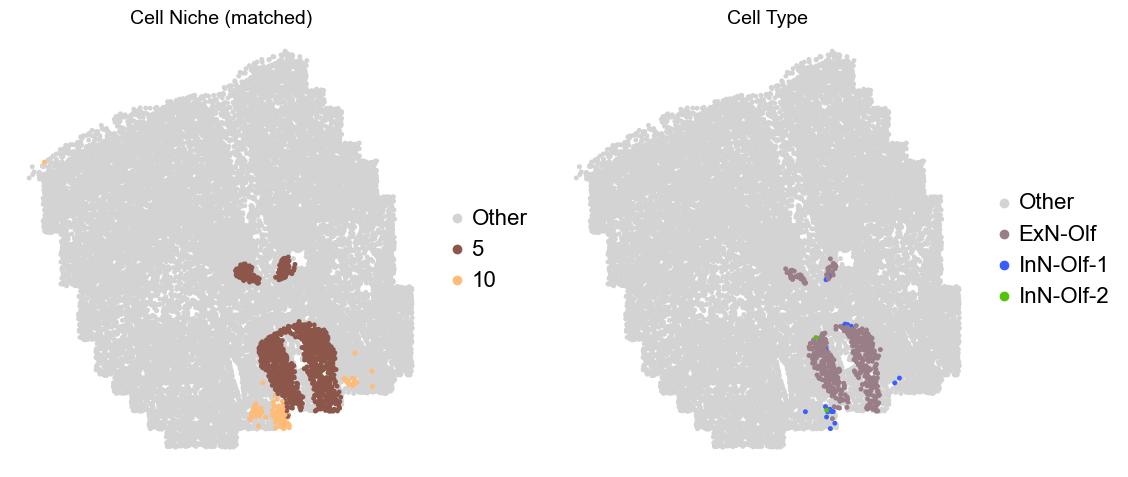
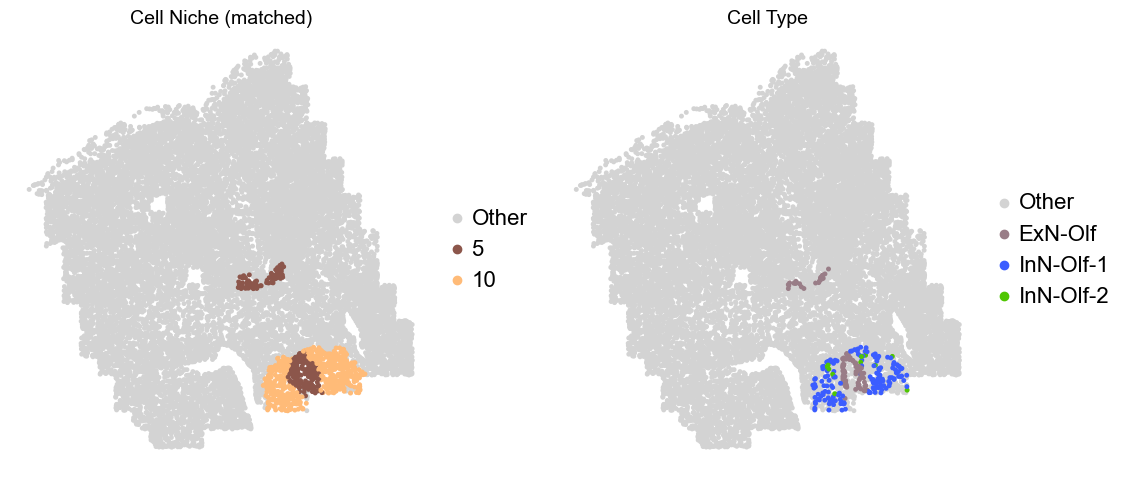
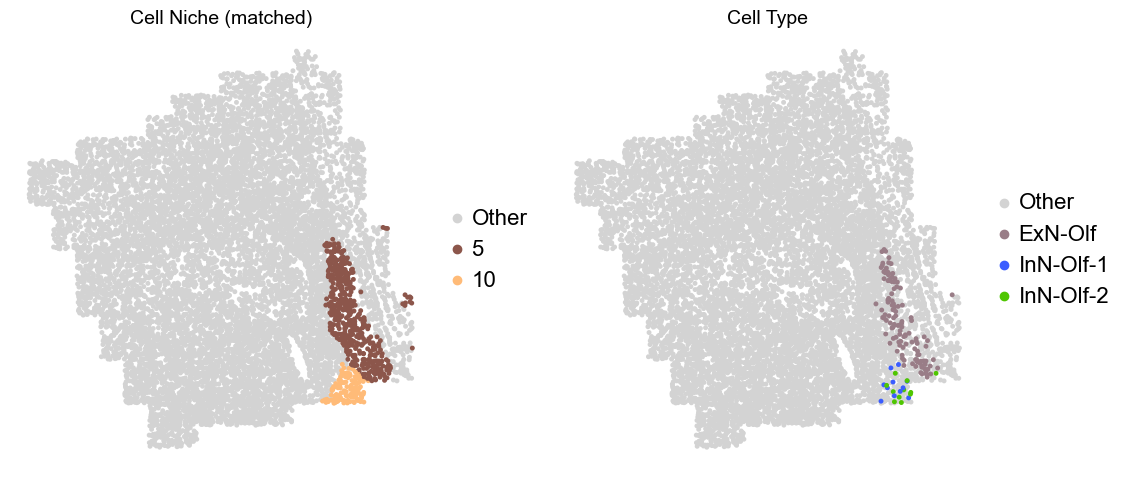
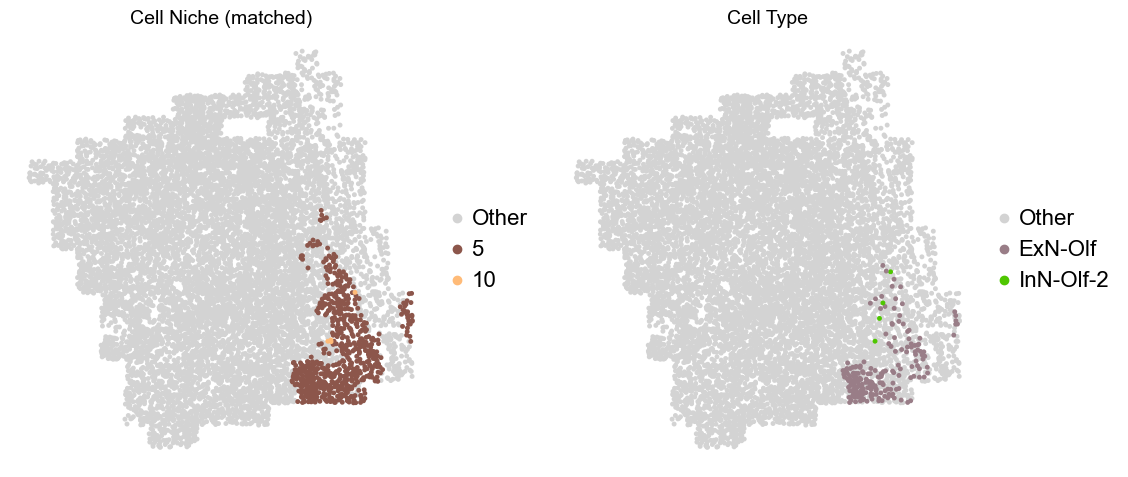
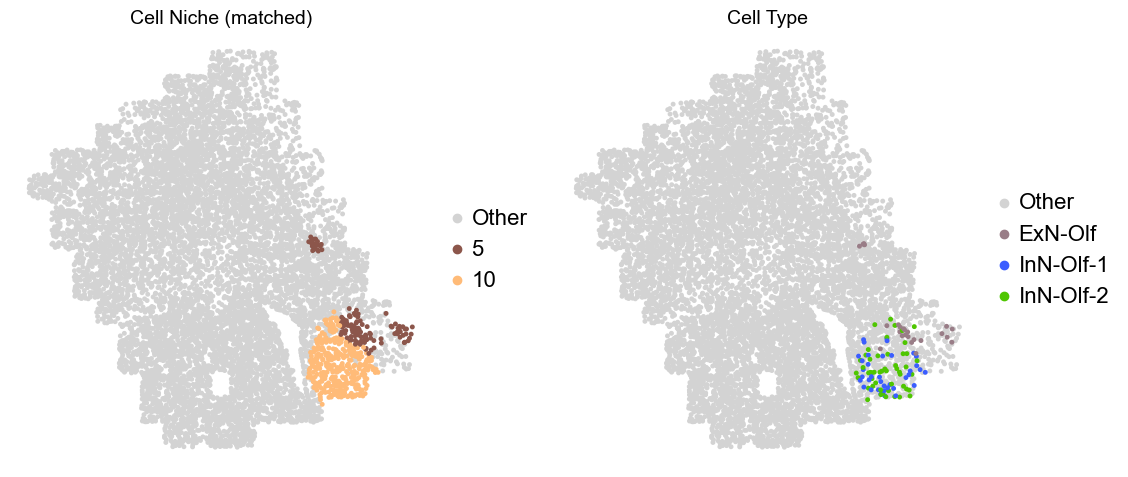
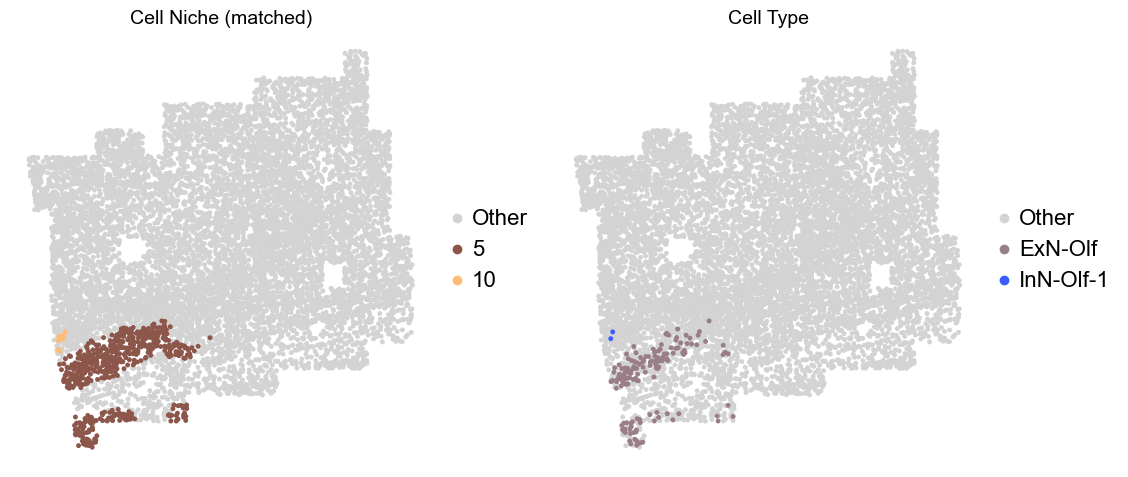
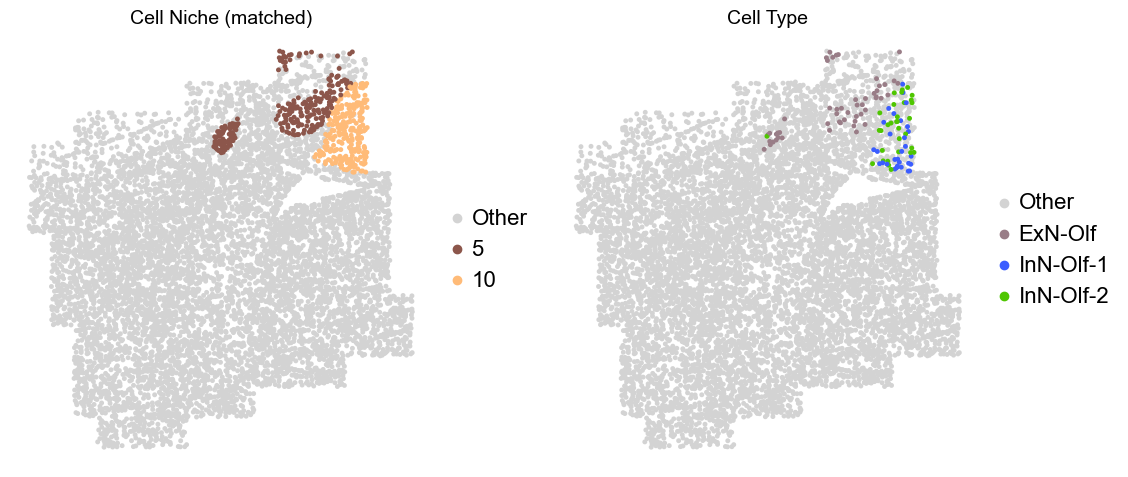
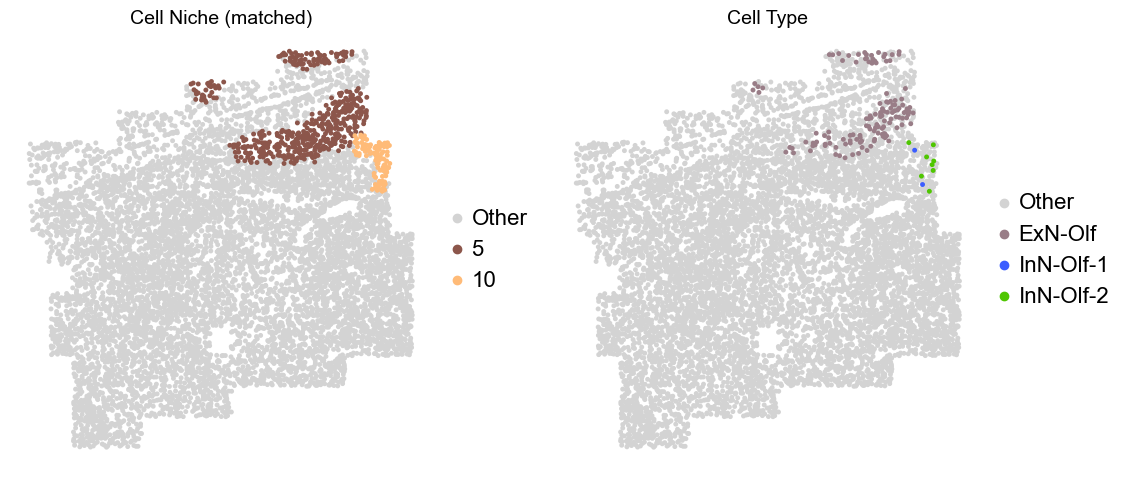
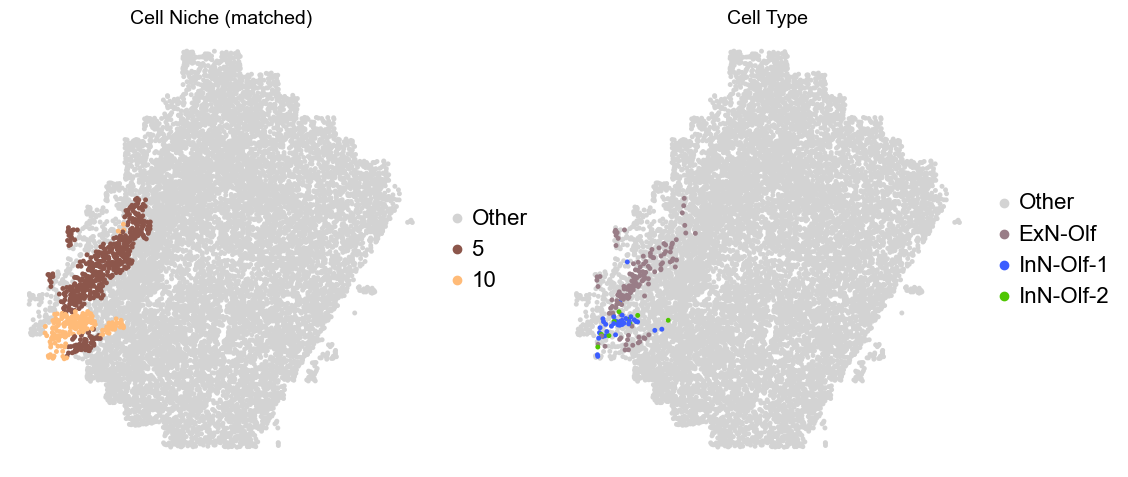
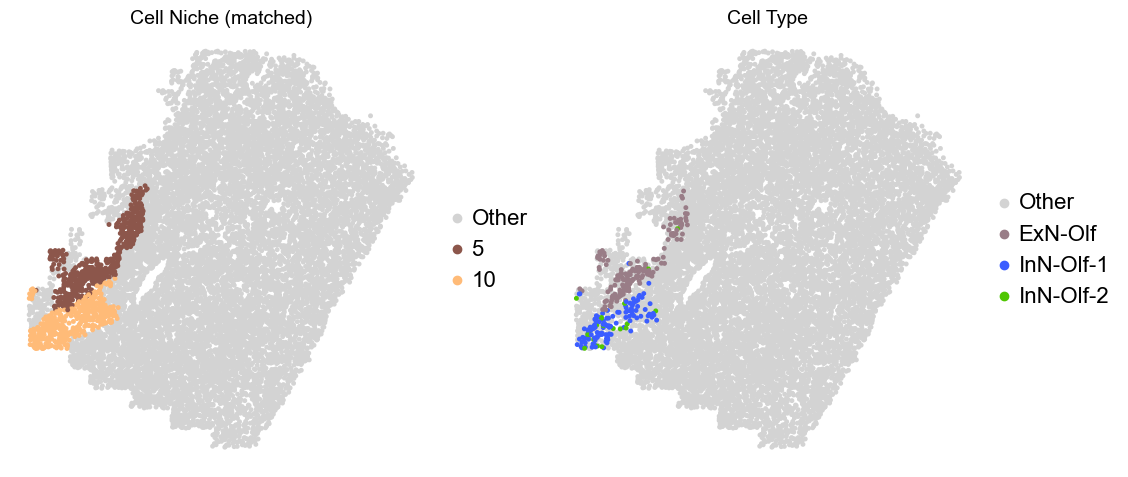
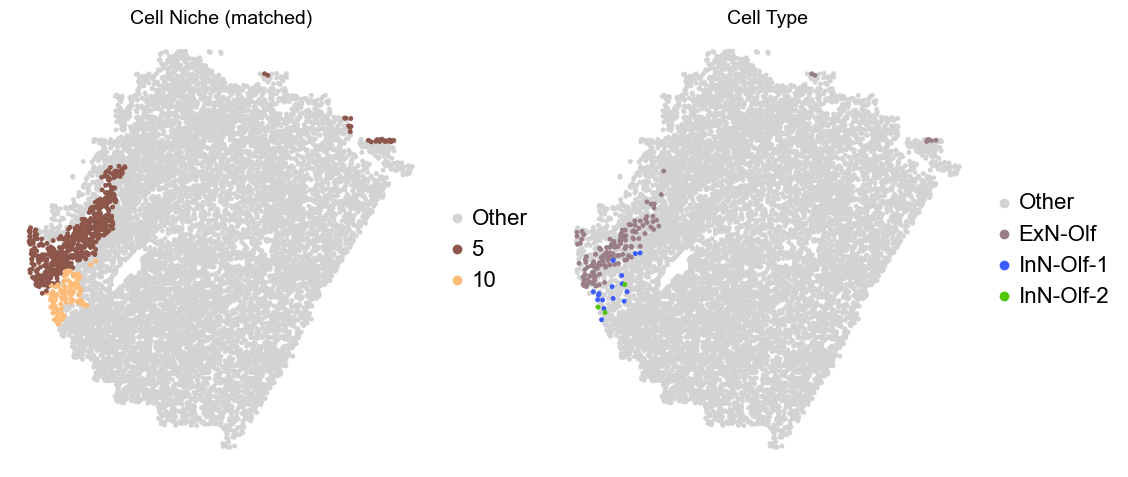
Olfactory region -> niche 5 (ExN-Olf) & 10 (InN-Olf-1, InN-Olf-2)
[15]:
ct_color_dict.update({'Other': '#D3D3D3'})
niche_color_dict.update({'Other': '#D3D3D3'})

for i in range(len(slice_name_list)):

    print(slice_name_list[i])
    adata = adata_concat[adata_concat.obs['slice_name'] == slice_name_list[i]].copy()
    adata.obs['niche_tmp'] = [ct if ct in ['5', '10'] else 'Other' for ct in adata.obs['matched_cluster']]
    adata.obs['ct_tmp'] = [ct if (ct in ['ExN-Olf', 'InN-Olf-1', 'InN-Olf-2']) and (adata.obs['niche_tmp'][idx] != 'Other') else 'Other' for idx, ct in enumerate(adata.obs['celltype_43'])]

    fig, axes = plt.subplots(1, 2, figsize=(11.5, 5))

    adata_other = adata[adata.obs['niche_tmp'] == 'Other'].copy()
    sc.pl.embedding(adata_other, basis='spatial', palette=niche_color_dict, color='niche_tmp',
                    ax=axes[0], s=50, show=False, frameon=False, title='Cell Niche (matched)', legend_fontsize=16)

    adata_sub = adata[adata.obs['niche_tmp'] != 'Other'].copy()
    sc.pl.embedding(adata_sub, basis='spatial', palette=niche_color_dict, color='niche_tmp',
                    ax=axes[0], s=50, show=False, frameon=False, title='Cell Niche (matched)', legend_fontsize=16)

    adata_other = adata[adata.obs['ct_tmp'] == 'Other'].copy()
    sc.pl.embedding(adata_other, basis='spatial', palette=ct_color_dict, color='ct_tmp',
                    ax=axes[1], s=50, show=False, frameon=False, title='Cell Type', legend_fontsize=16)

    adata_sub = adata[adata.obs['ct_tmp'] != 'Other'].copy()
    sc.pl.embedding(adata_sub, basis='spatial', palette=ct_color_dict, color='ct_tmp',
                    ax=axes[1], s=50, show=False, frameon=False, title='Cell Type', legend_fontsize=16)

    plt.tight_layout()
    plt.show()
Donor1_Slice0_4wk
Donor4_Slice0_4wk
Donor4_Slice1_4wk
Donor4_Slice2_4wk
Donor7_Slice0_4wk
Donor7_Slice1_4wk
Donor7_Slice2_4wk
Donor8_Slice0_4wk
Donor8_Slice1_4wk
Donor8_Slice2_4wk
Donor10_Slice0_24wk
Donor10_Slice1_24wk
Donor10_Slice2_24wk
Donor11_Slice0_24wk
Donor11_Slice1_24wk
Donor11_Slice2_24wk
Donor12_Slice0_24wk
Donor12_Slice1_24wk
Donor2_Slice0_90wk
Donor2_Slice1_90wk
Donor3_Slice0_90wk
Donor3_Slice1_90wk
Donor5_Slice0_90wk
Donor5_Slice1_90wk
Donor5_Slice2_90wk
Donor6_Slice0_90wk
Donor6_Slice1_90wk
Donor6_Slice2_90wk
Donor9_Slice0_90wk
Donor9_Slice1_90wk
Donor9_Slice2_90wk
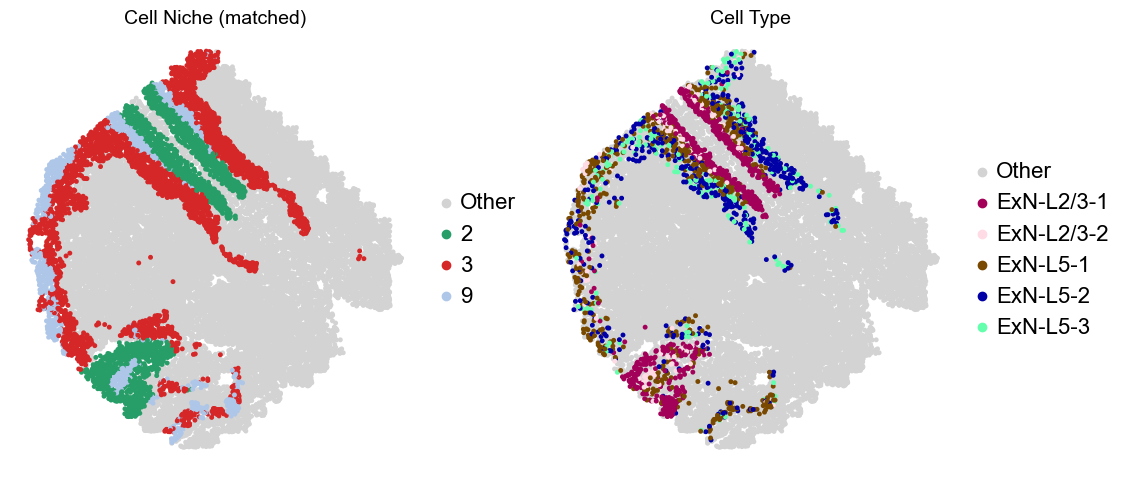
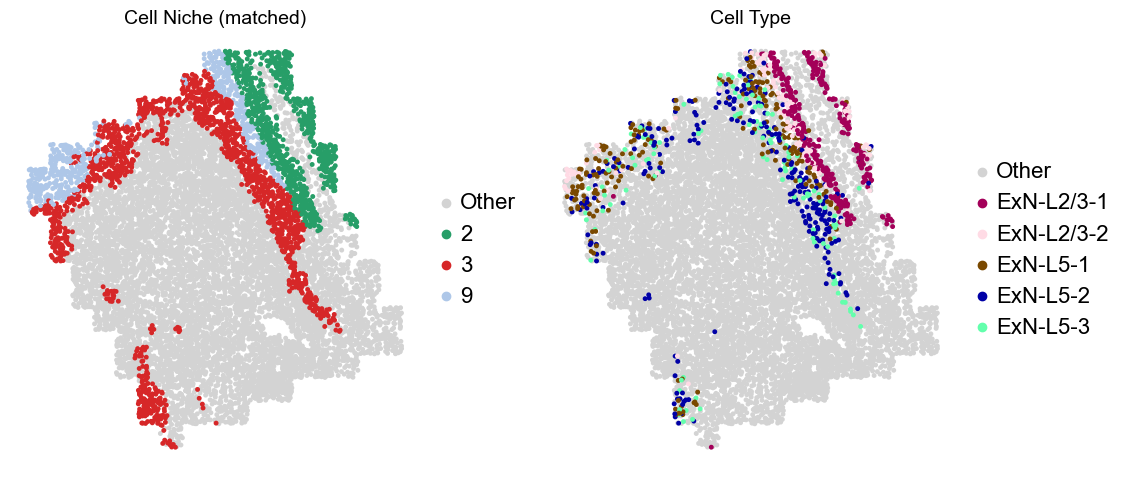
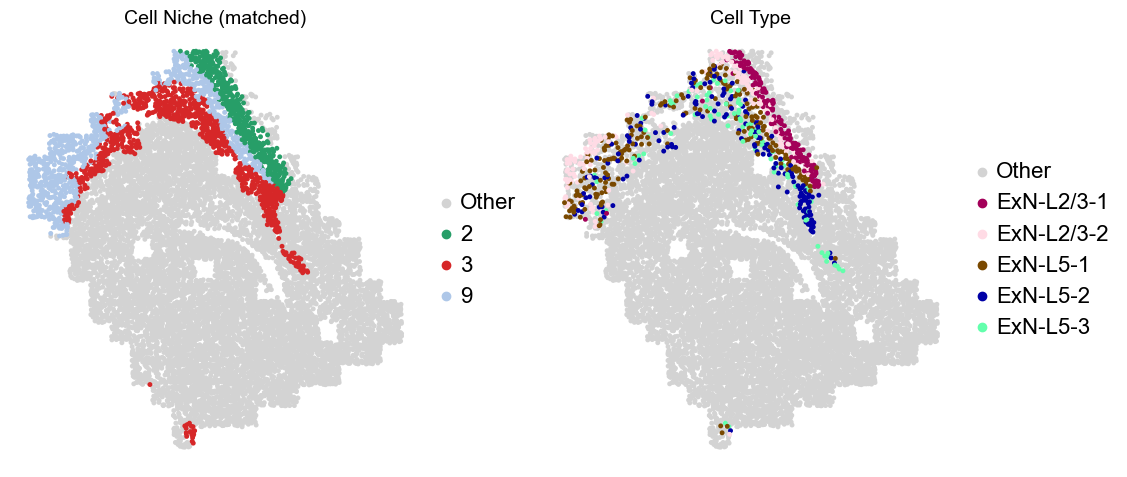
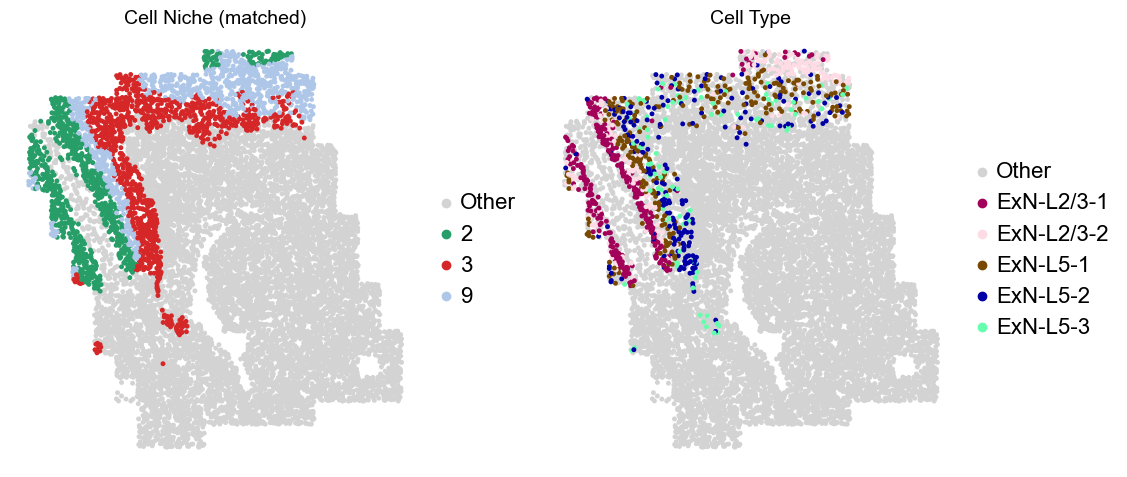
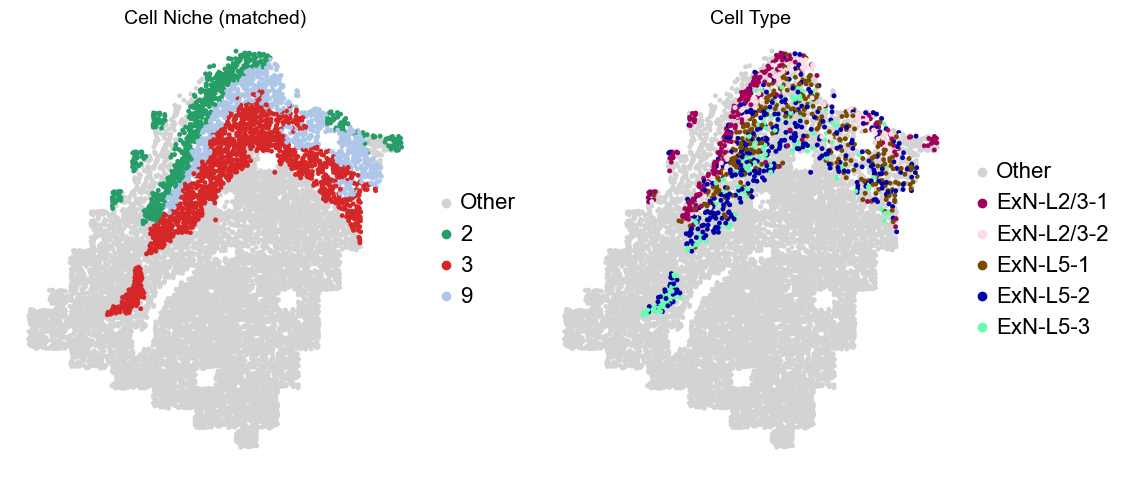
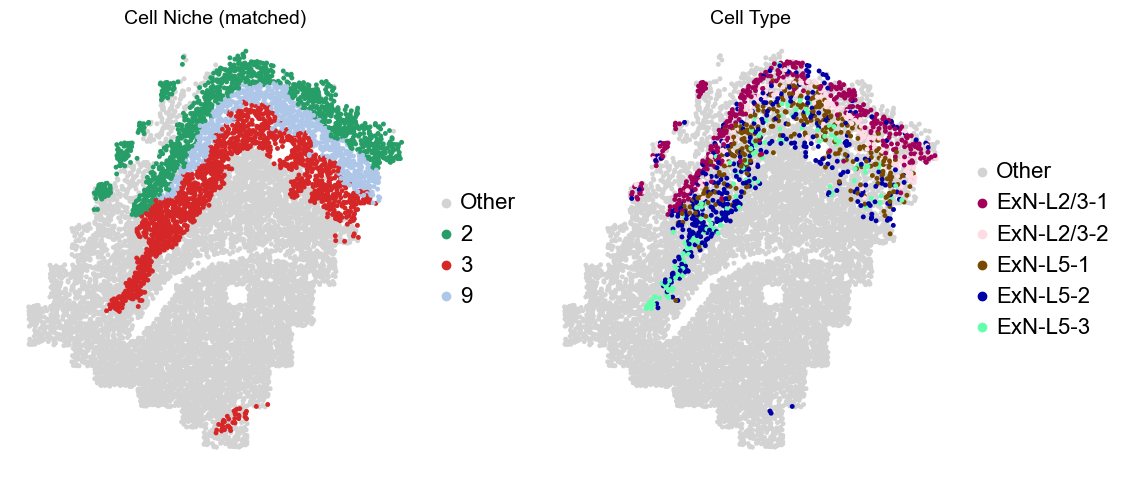
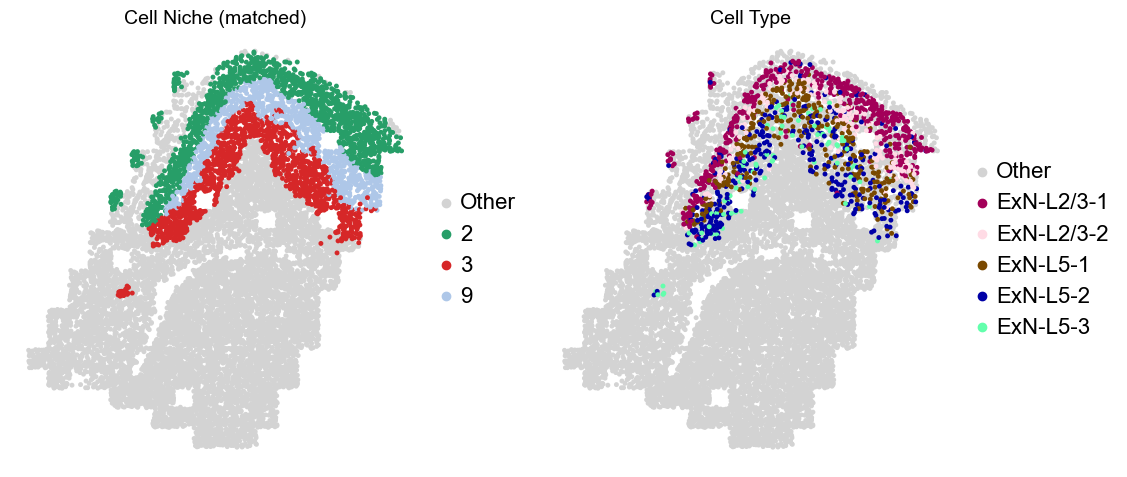
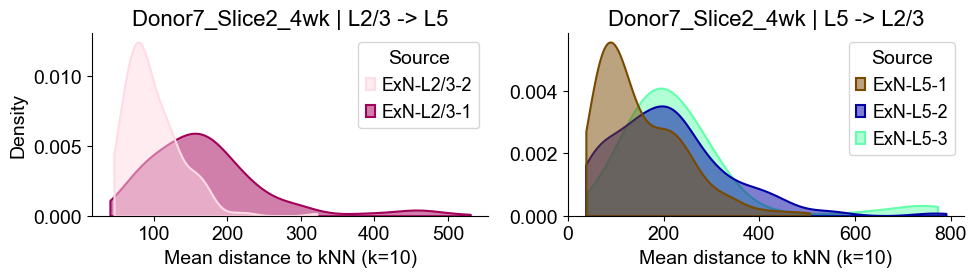
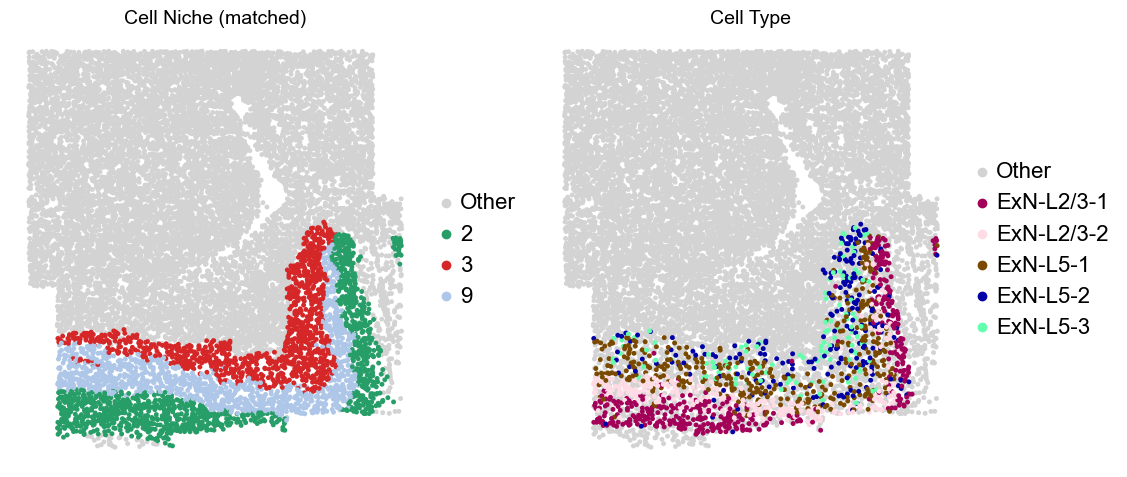
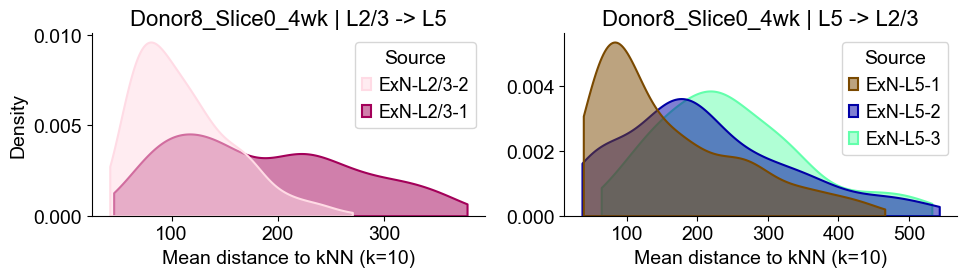
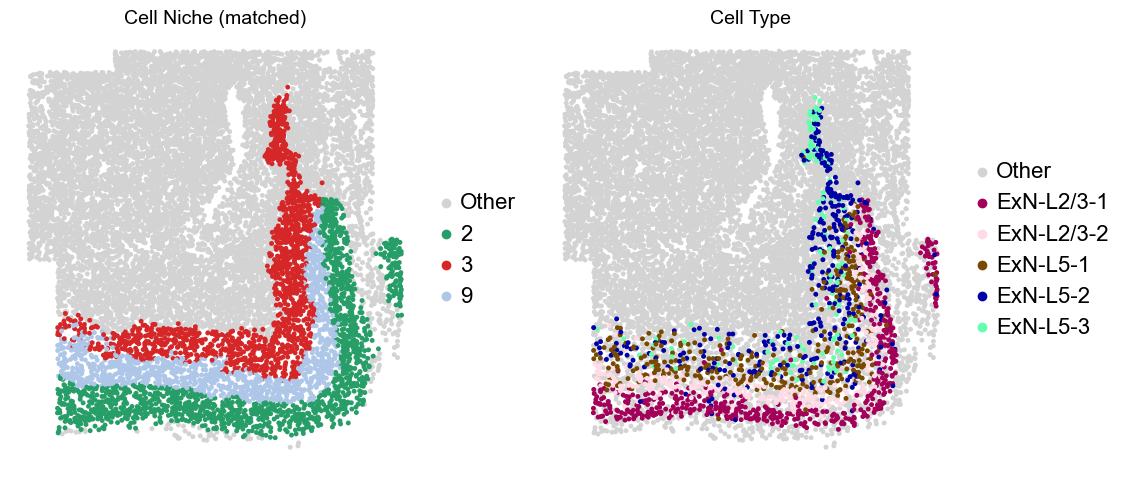
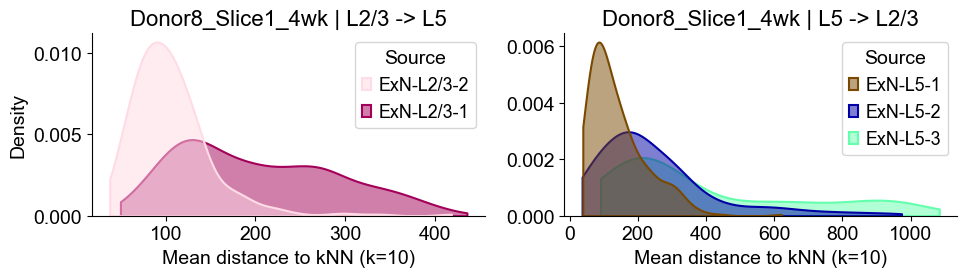
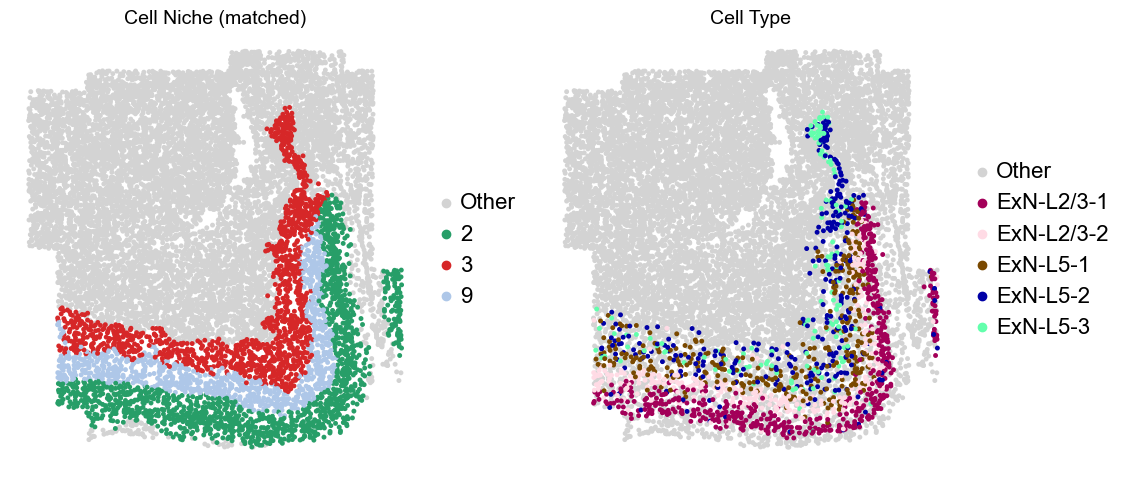
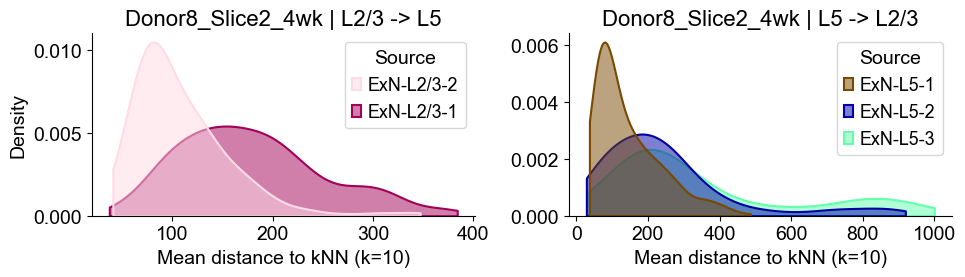
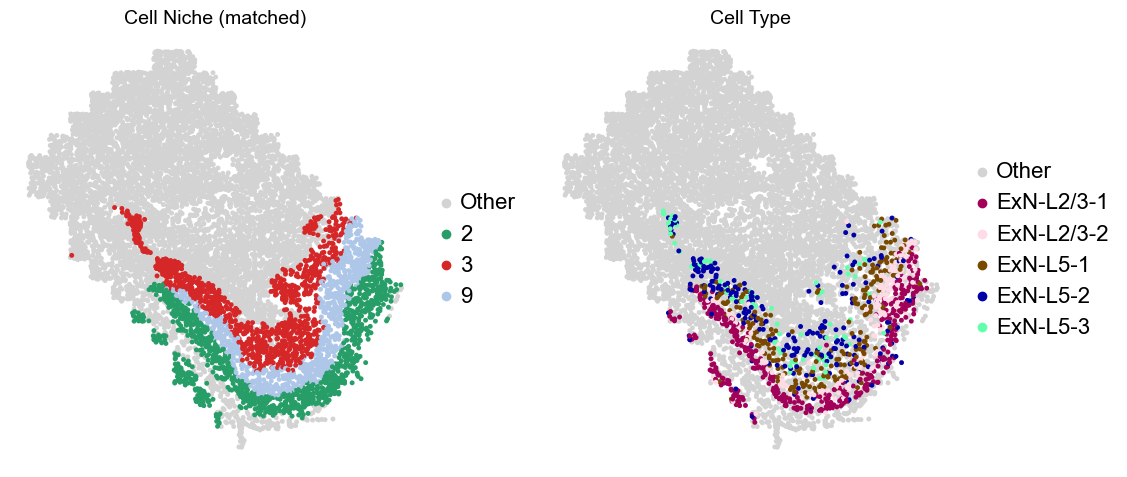
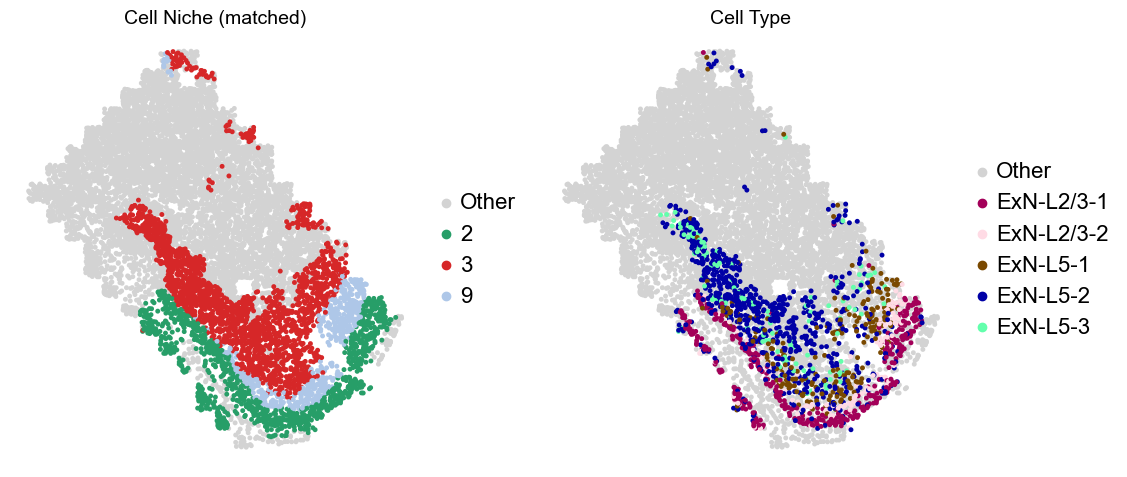
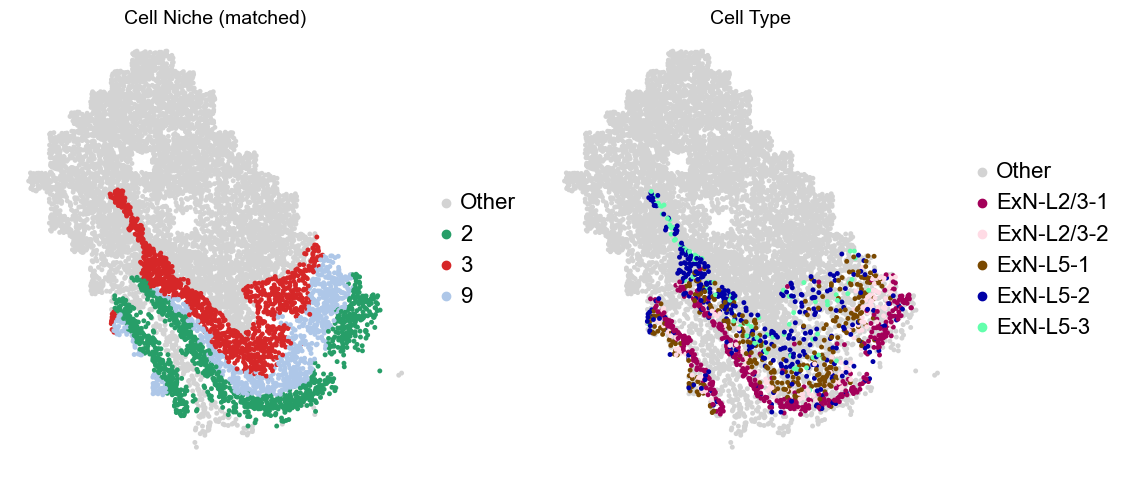
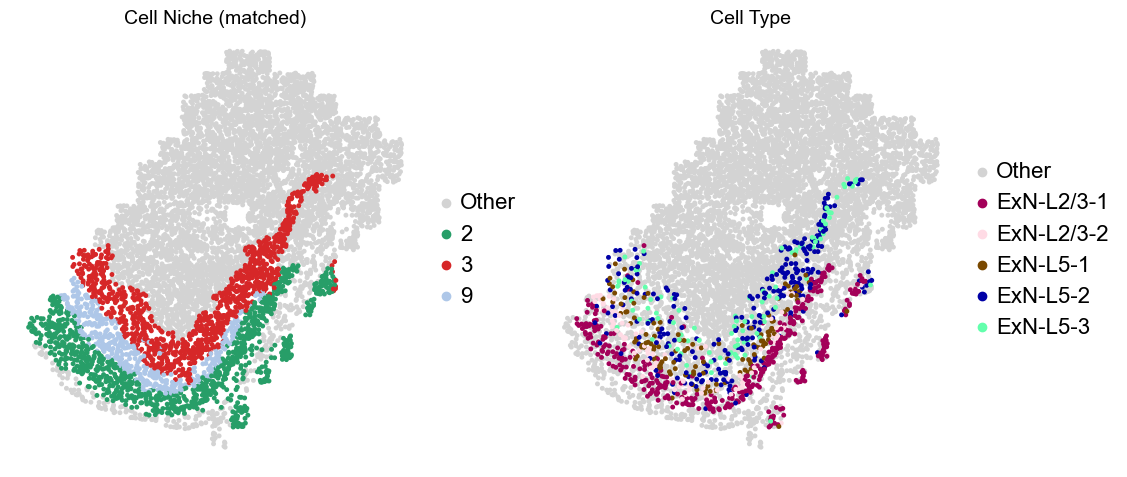
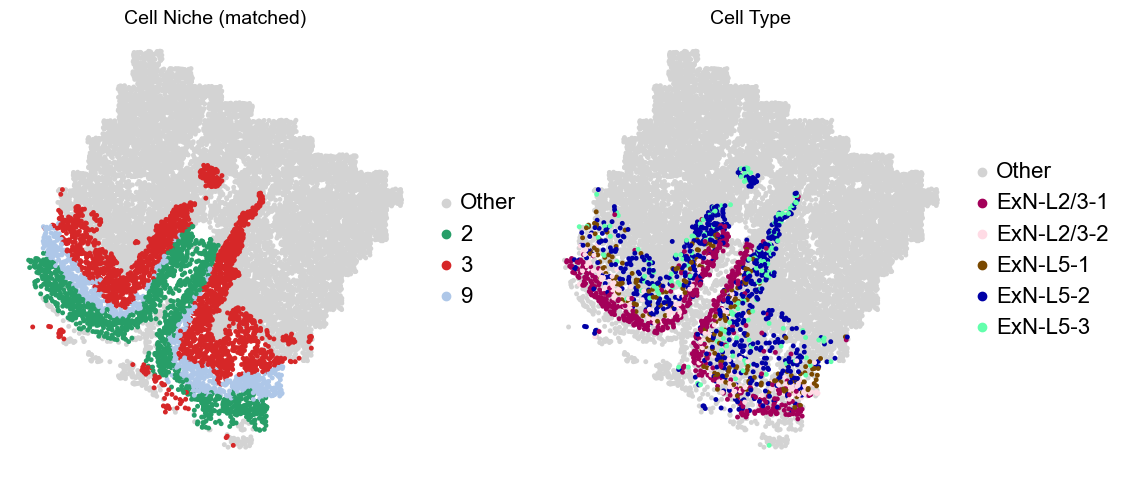
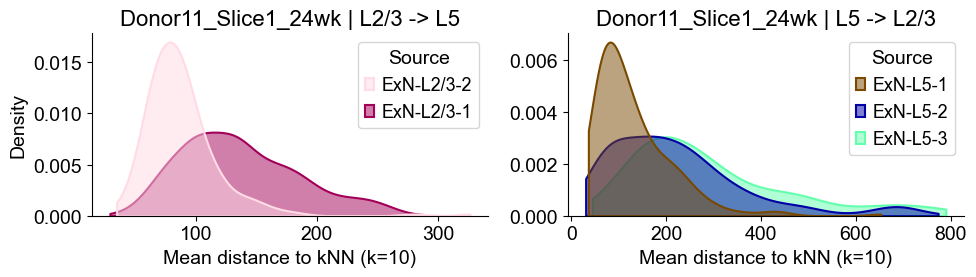
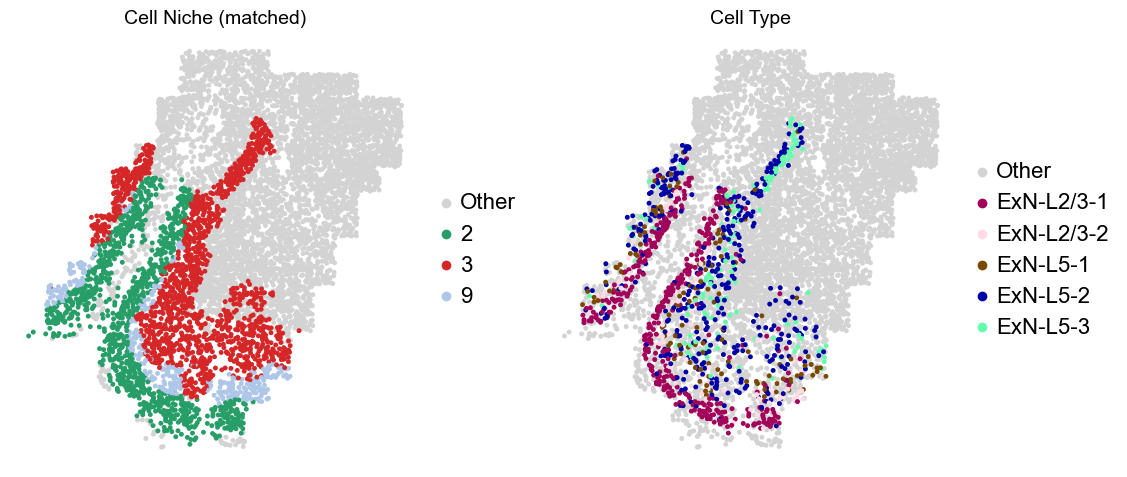
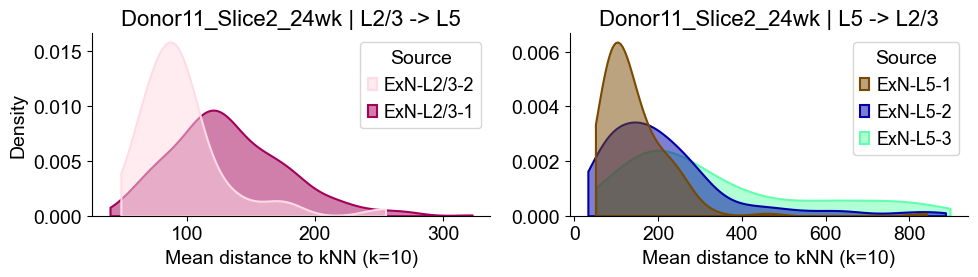
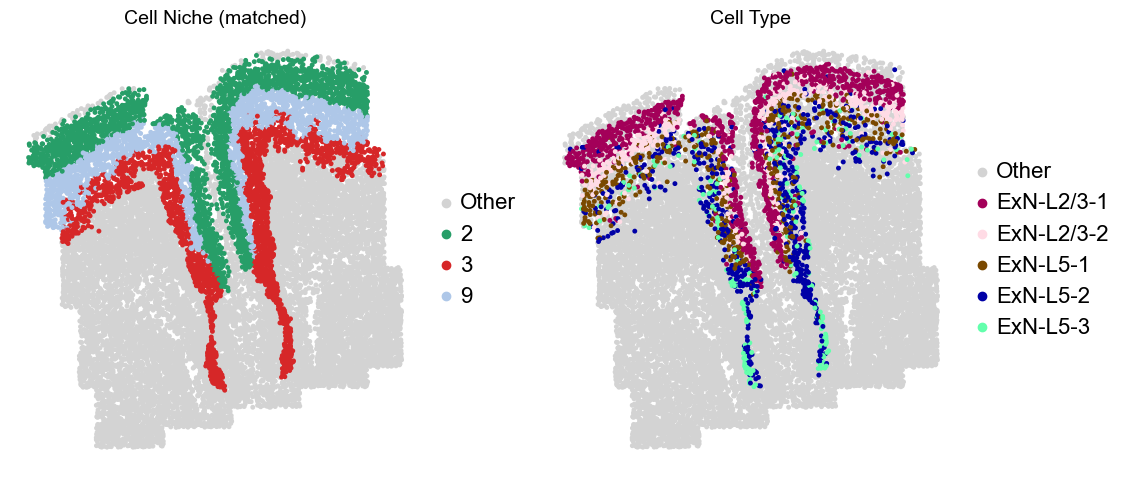
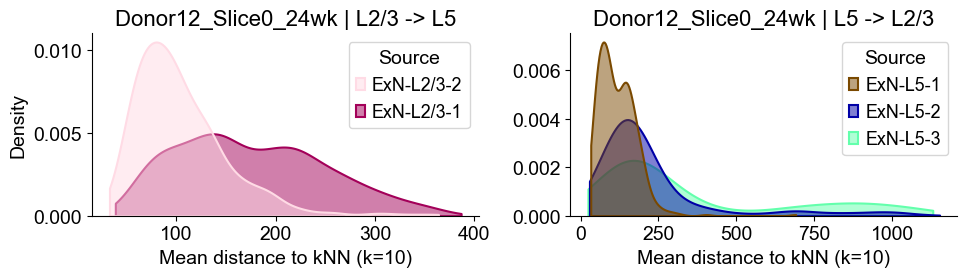
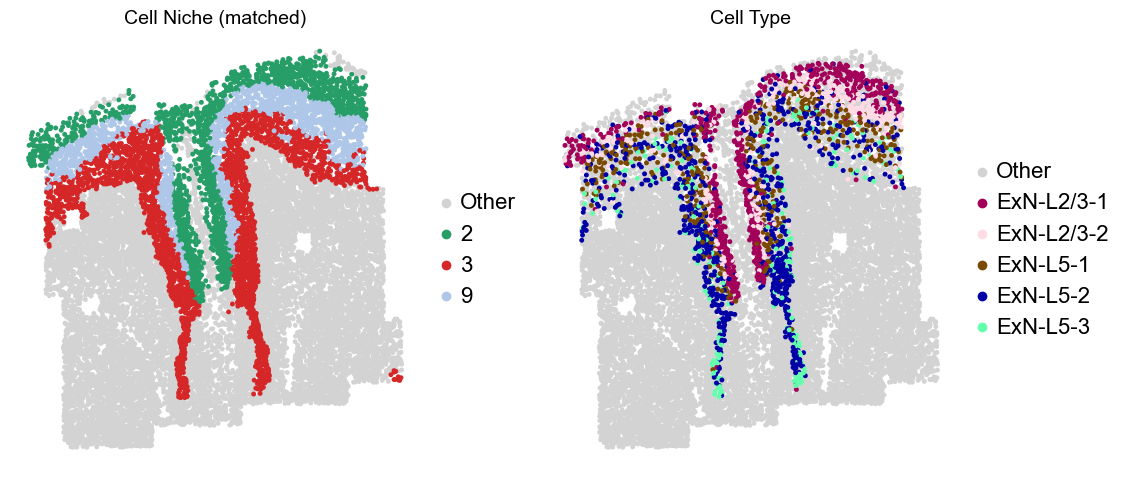
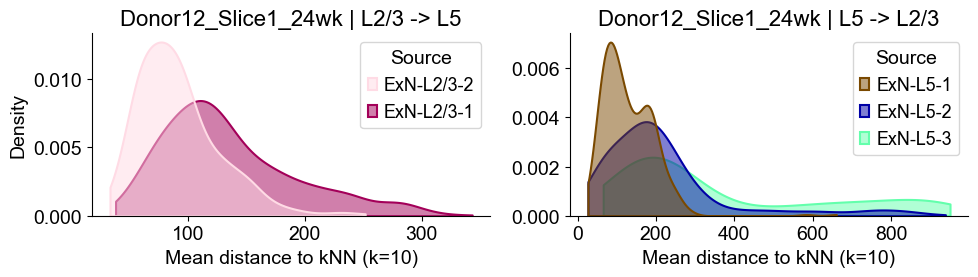
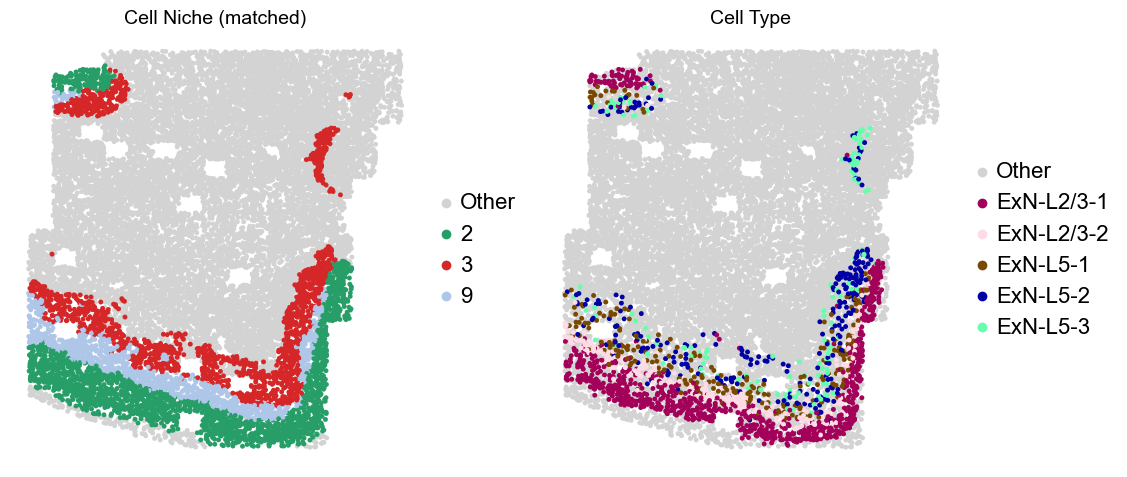
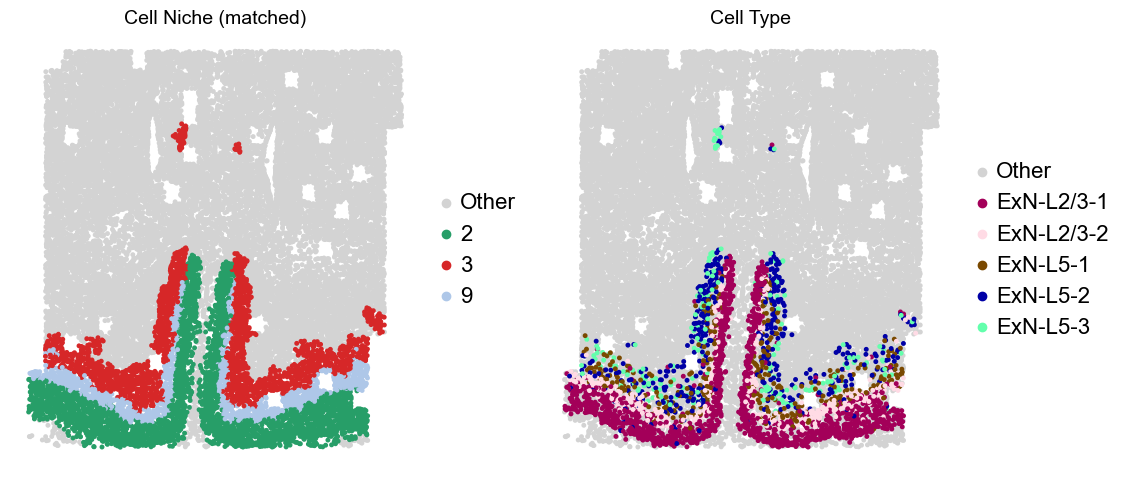
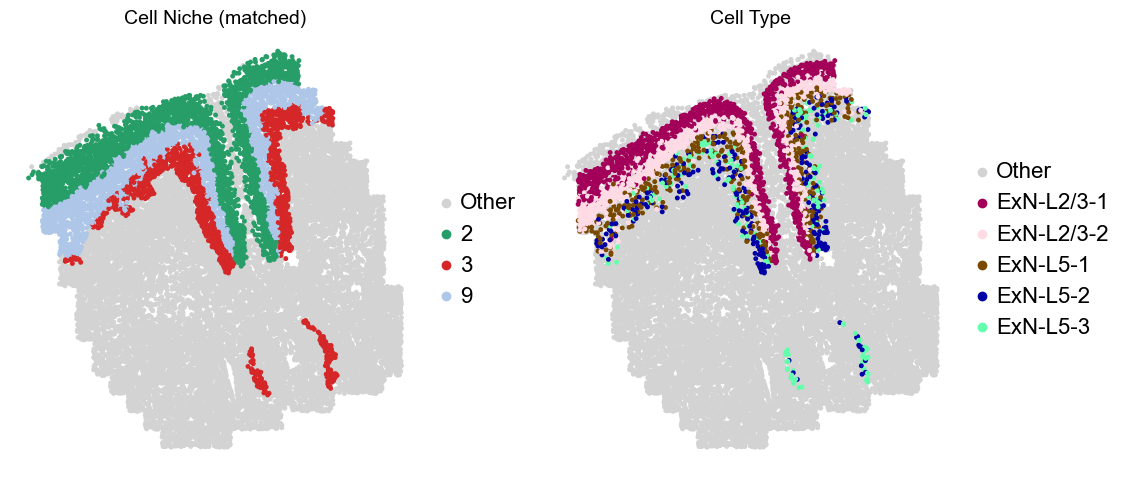
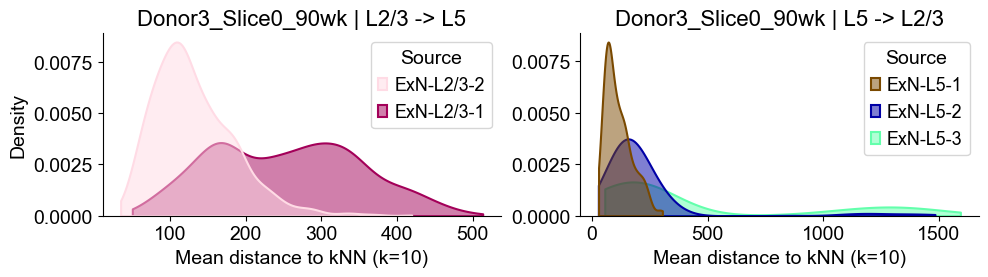
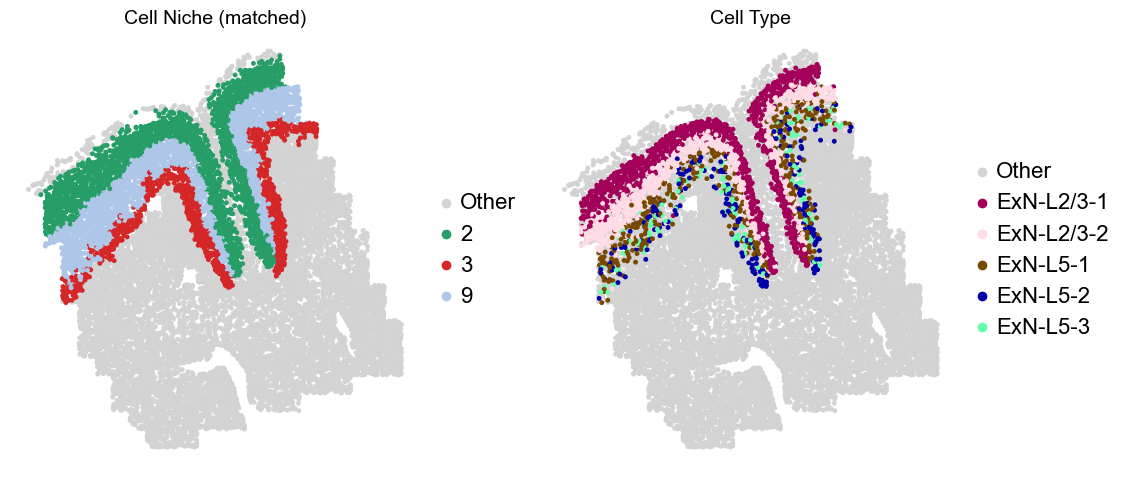
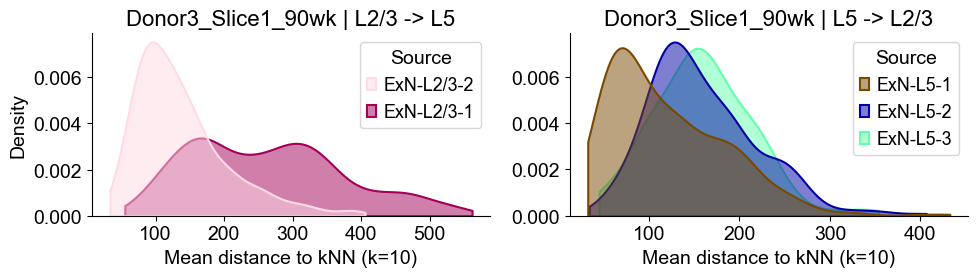
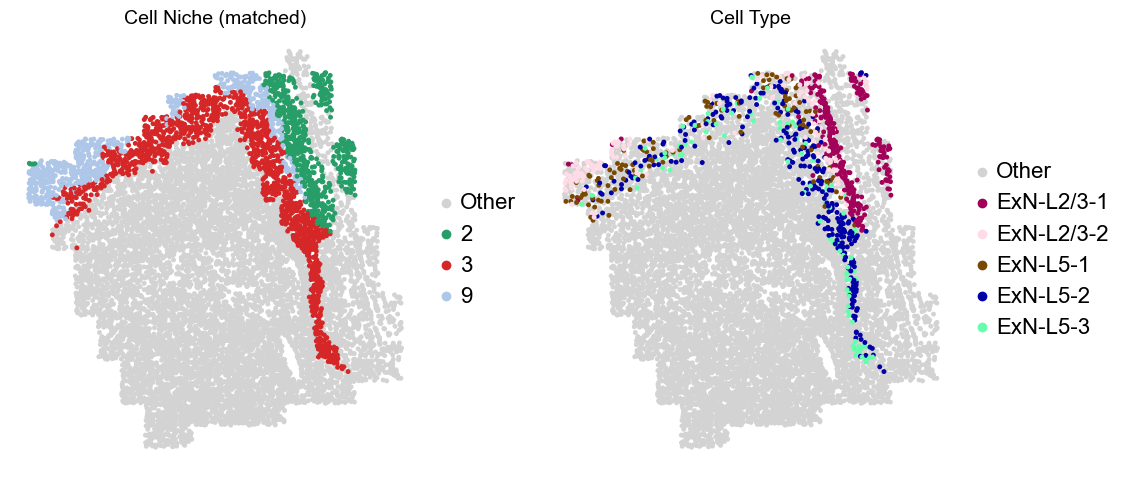
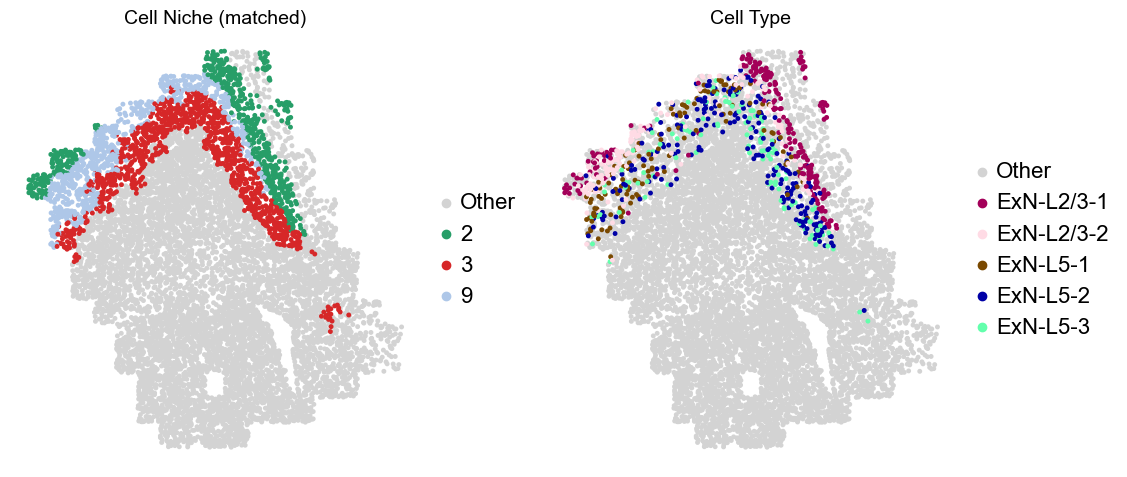
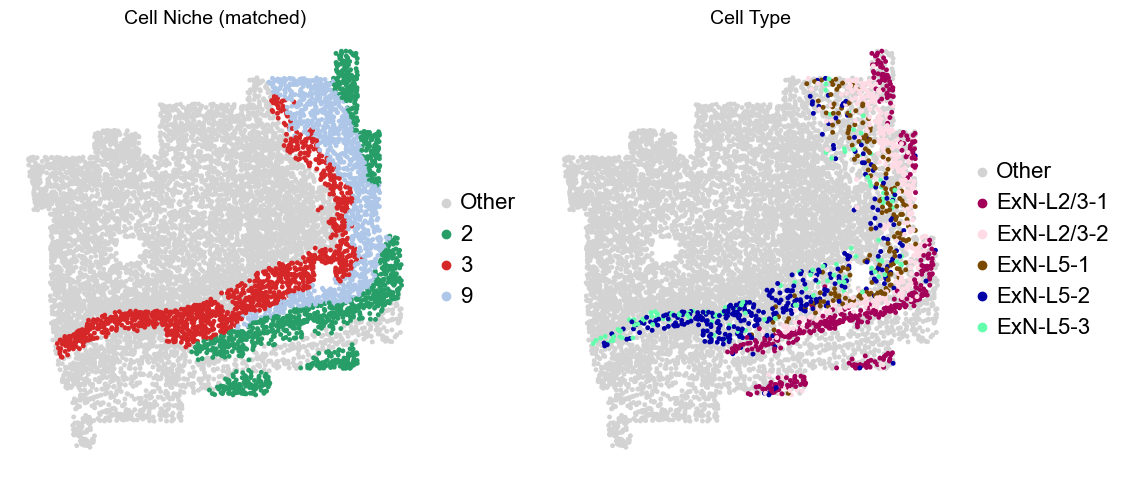
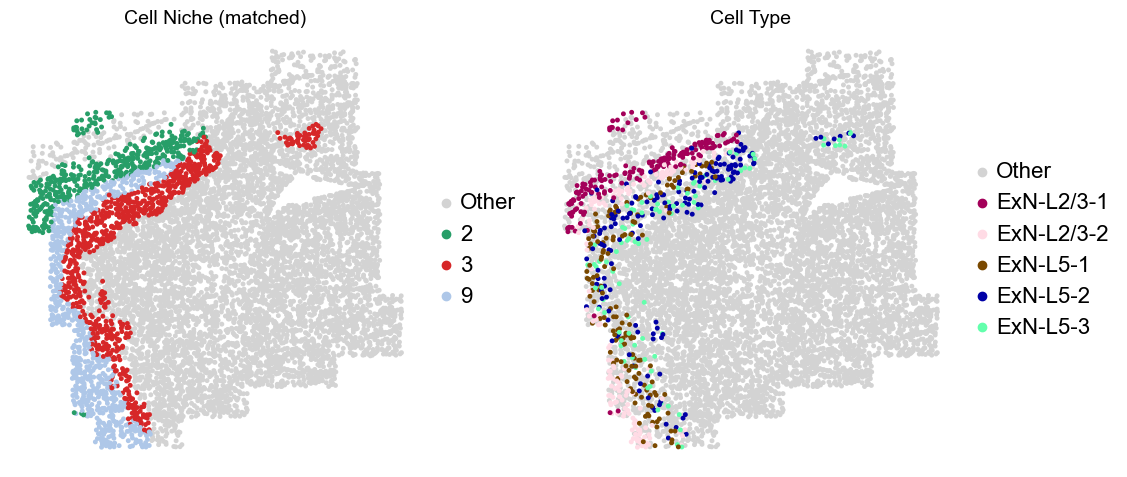
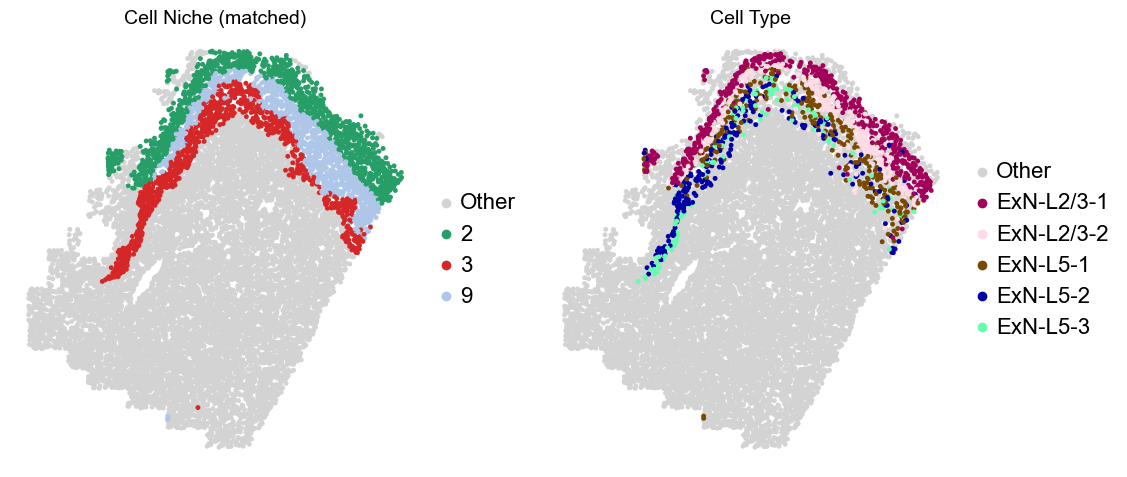
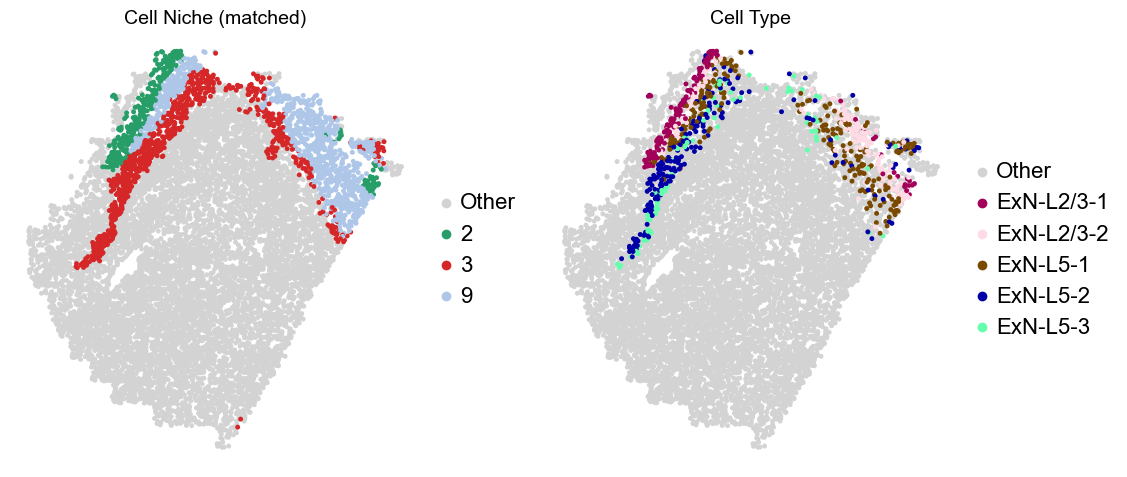
Layer II/III & Layer V -> Niche 2, 3 & 8
[16]:
def mean_dist_to_knn(X, source_mask, target_mask, k=10):
    src_idx = np.where(source_mask)[0]
    tgt_idx = np.where(target_mask)[0]

    if len(src_idx) == 0 or len(tgt_idx) == 0:
        return np.full(len(src_idx), np.nan), src_idx

    same_set = np.array_equal(src_idx, tgt_idx)

    if same_set:
        k_eff = min(k + 1, len(tgt_idx))
    else:
        k_eff = min(k, len(tgt_idx))

    nn = NearestNeighbors(n_neighbors=k_eff, metric="euclidean")
    nn.fit(X[tgt_idx])
    dists, inds = nn.kneighbors(X[src_idx])

    if same_set:
        dists = dists[:, 1:]

    return np.mean(dists, axis=1), src_idx
[17]:
ct_color_dict.update({'Other': '#D3D3D3'})
niche_color_dict.update({'Other': '#D3D3D3'})
dist_map_l5 = {'ExN-L5-1': [], 'ExN-L5-2': [], 'ExN-L5-3': [],}
dist_map_l5_4wk = {'ExN-L5-1': [], 'ExN-L5-2': [], 'ExN-L5-3': [],}
dist_map_l5_24wk = {'ExN-L5-1': [], 'ExN-L5-2': [], 'ExN-L5-3': [],}
dist_map_l5_90wk = {'ExN-L5-1': [], 'ExN-L5-2': [], 'ExN-L5-3': [],}
dist_map_l23 = {'ExN-L2/3-1': [], 'ExN-L2/3-2': [],}
dist_map_l23_4wk = {'ExN-L2/3-1': [], 'ExN-L2/3-2': [],}
dist_map_l23_24wk = {'ExN-L2/3-1': [], 'ExN-L2/3-2': [],}
dist_map_l23_90wk = {'ExN-L2/3-1': [], 'ExN-L2/3-2': [],}
for i in range(len(slice_name_list)):
dist_map_l5_per_slice = {'ExN-L5-1': [], 'ExN-L5-2': [], 'ExN-L5-3': [],}
dist_map_l23_per_slice = {'ExN-L2/3-1': [], 'ExN-L2/3-2': [],}
print(slice_name_list[i])
adata = adata_concat[adata_concat.obs['slice_name'] == slice_name_list[i]].copy()
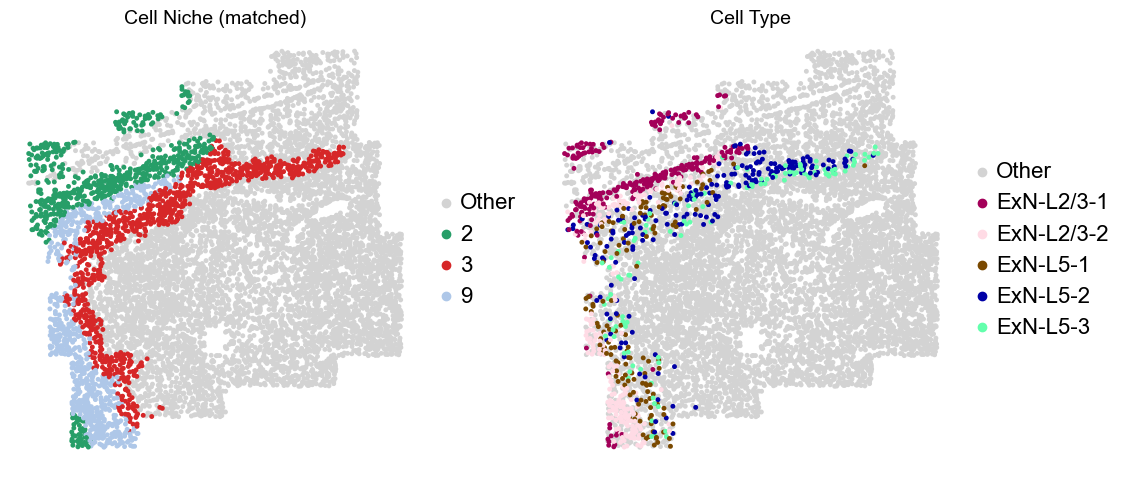
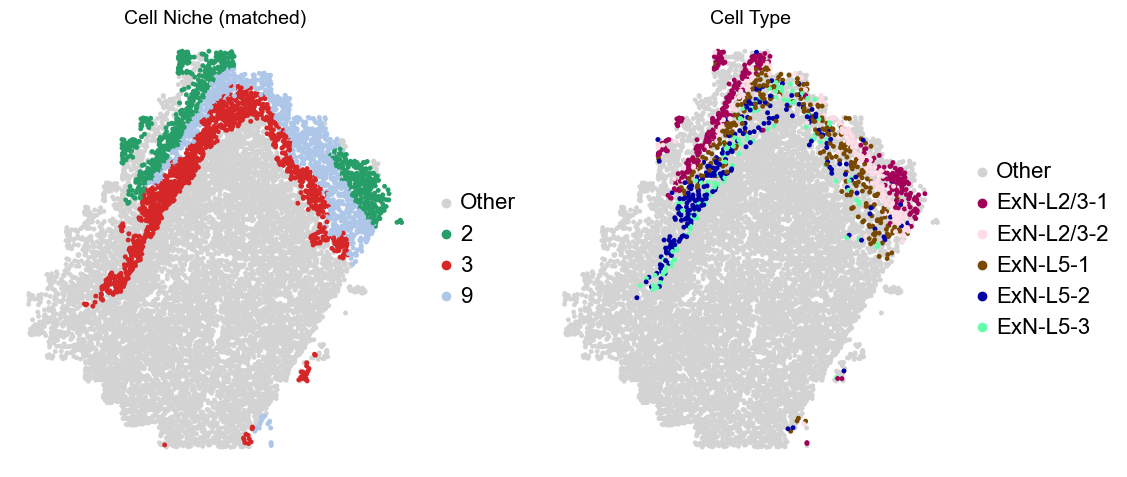
adata.obs['niche_tmp'] = [ct if ct in ['2', '3', '9'] else 'Other' for ct in adata.obs['matched_cluster']]
adata.obs['ct_tmp'] = [ct if (ct in ['ExN-L2/3-1', 'ExN-L2/3-2', 'ExN-L5-1', 'ExN-L5-2', 'ExN-L5-3']) and (adata.obs['niche_tmp'][idx] != 'Other')
else 'Other' for idx, ct in enumerate(adata.obs['celltype_43'])]
fig, axes = plt.subplots(1, 2, figsize=(11.5, 5))
adata_other = adata[adata.obs['niche_tmp'] == 'Other'].copy()
sc.pl.embedding(adata_other, basis='spatial', palette=niche_color_dict, color='niche_tmp',
ax=axes[0], s=50, show=False, frameon=False, title='Cell Niche (matched)', legend_fontsize=16)
adata_sub = adata[adata.obs['niche_tmp'] != 'Other'].copy()
sc.pl.embedding(adata_sub, basis='spatial', palette=niche_color_dict, color='niche_tmp',
ax=axes[0], s=50, show=False, frameon=False, title='Cell Niche (matched)', legend_fontsize=16)
adata_other = adata[adata.obs['ct_tmp'] == 'Other'].copy()
sc.pl.embedding(adata_other, basis='spatial', palette=ct_color_dict, color='ct_tmp',
ax=axes[1], s=50, show=False, frameon=False, title='Cell Type', legend_fontsize=16)
adata_sub = adata[adata.obs['ct_tmp'] != 'Other'].copy()
sc.pl.embedding(adata_sub, basis='spatial', palette=ct_color_dict, color='ct_tmp',
ax=axes[1], s=50, show=False, frameon=False, title='Cell Type', legend_fontsize=16)
###--------------------------------------
X = np.asarray(adata_sub.obsm['spatial'], dtype=float)
ct = adata_sub.obs['ct_tmp'].astype(str).to_numpy()
niche = adata_sub.obs['niche_tmp'].astype(str).to_numpy()
l23_types = ['ExN-L2/3-2', 'ExN-L2/3-1']
l5_types = ['ExN-L5-1', 'ExN-L5-2', 'ExN-L5-3']
target_L23_mask = np.isin(ct, l23_types)
target_L5_mask = np.isin(ct, l5_types)
for src_type in l23_types:
source_mask = (ct == src_type)# & (np.isin(niche, ['2', '9']))
mdist, src_idx = mean_dist_to_knn(X, source_mask, target_L5_mask, k=10)
if adata.obs['age'][0] == '4wk':
dist_map_l23_4wk[src_type].append(np.median(mdist))
elif adata.obs['age'][0] == '24wk':
dist_map_l23_24wk[src_type].append(np.median(mdist))
else:
dist_map_l23_90wk[src_type].append(np.median(mdist))
dist_map_l23[src_type].append(np.median(mdist))
dist_map_l23_per_slice[src_type].extend(mdist)
for src_type in l5_types:
source_mask = (ct == src_type)# & (np.isin(niche, ['3', '9']))
mdist, src_idx = mean_dist_to_knn(X, source_mask, target_L23_mask, k=10)
if adata.obs['age'][0] == '4wk':
dist_map_l5_4wk[src_type].append(np.median(mdist))
elif adata.obs['age'][0] == '24wk':
dist_map_l5_24wk[src_type].append(np.median(mdist))
else:
dist_map_l5_90wk[src_type].append(np.median(mdist))
dist_map_l5[src_type].append(np.median(mdist))
dist_map_l5_per_slice[src_type].extend(mdist)
plt.tight_layout()
plt.show()
rows = []
for src_type in l23_types:
if len(dist_map_l23_per_slice[src_type]) == 0:
continue
md = dist_map_l23_per_slice[src_type]
rows.append(pd.DataFrame({"slice_name": slice_name_list[i], "age": adata.obs["age"][0],
"group": "L2/3", "Source": src_type, "distance": md}))
for src_type in l5_types:
if len(dist_map_l5_per_slice[src_type]) == 0:
continue
md = dist_map_l5_per_slice[src_type]
rows.append(pd.DataFrame({"slice_name": slice_name_list[i], "age": adata.obs["age"][0],
"group": "L5", "Source": src_type, "distance": md}))
if len(rows) == 0:
print(f"[{slice_name_list[i]}] no distances to plot")
else:
dist_df = pd.concat(rows, ignore_index=True)
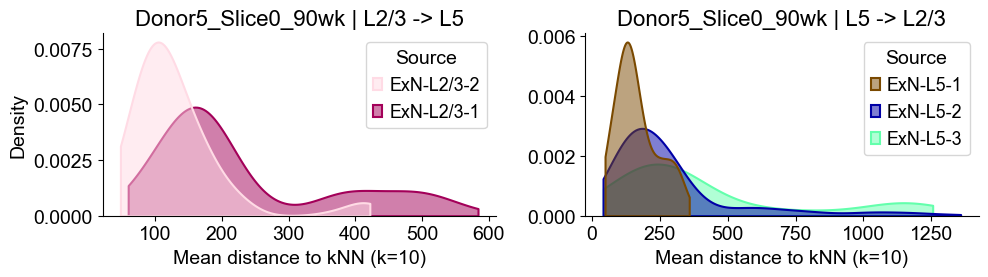
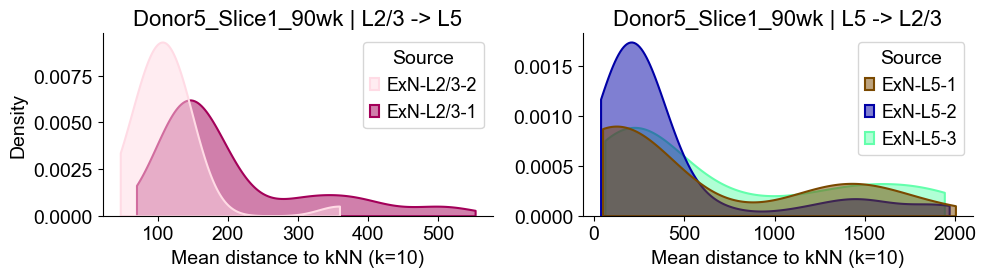
fig2, axes2 = plt.subplots(1, 2, figsize=(10, 3))
sub_l23 = dist_df[dist_df["group"] == "L2/3"]
sns.kdeplot(data=sub_l23, x="distance", hue="Source", common_norm=False, fill=True,
alpha=0.5, linewidth=1.5, palette=ct_color_dict, ax=axes2[0], cut=0, bw_adjust=1)
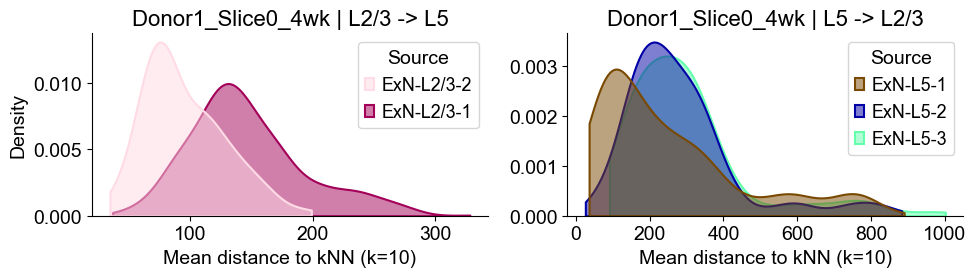
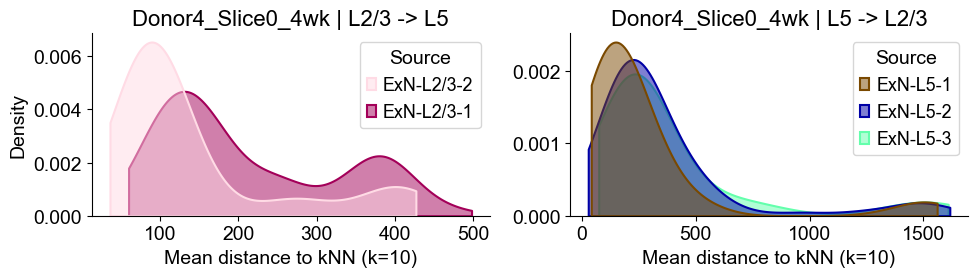
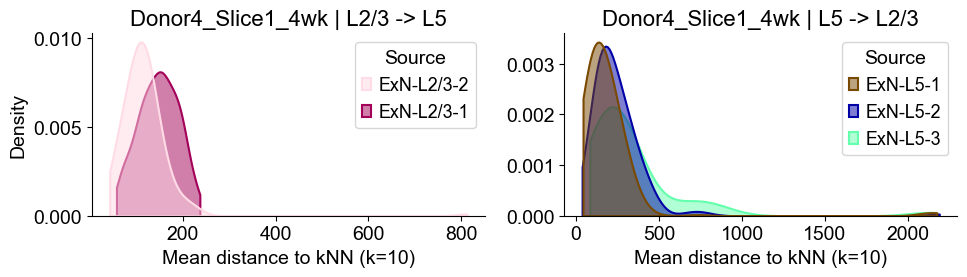
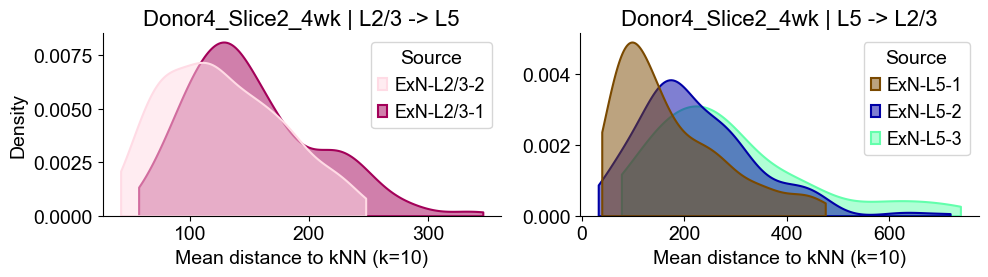
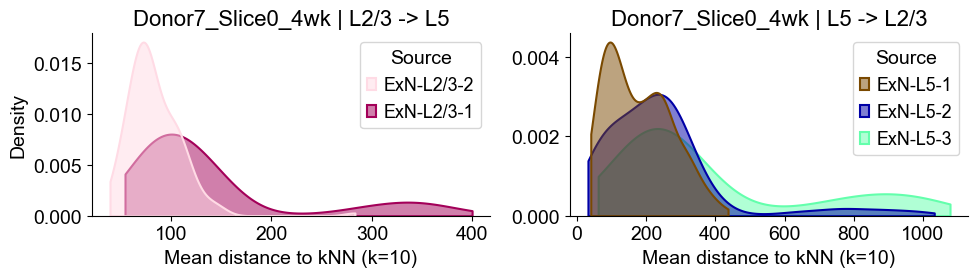
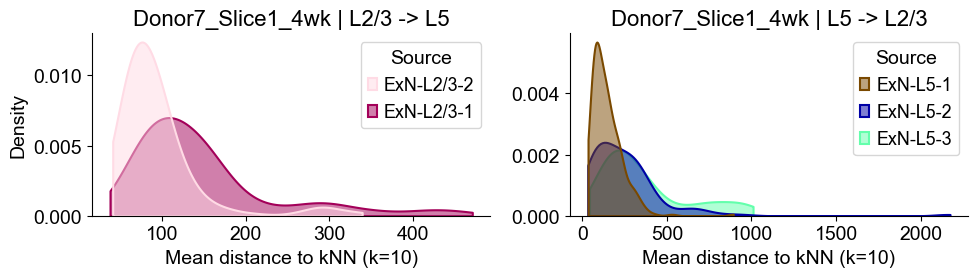
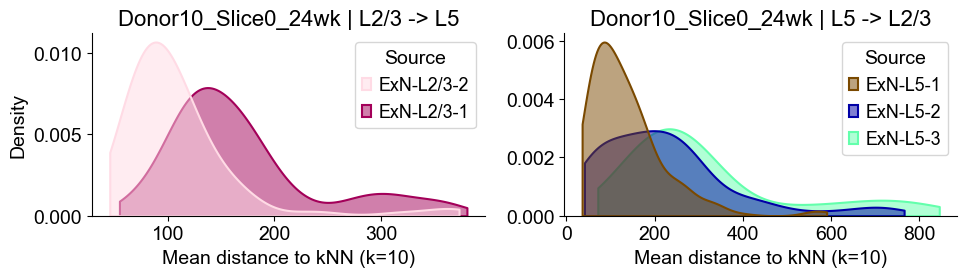
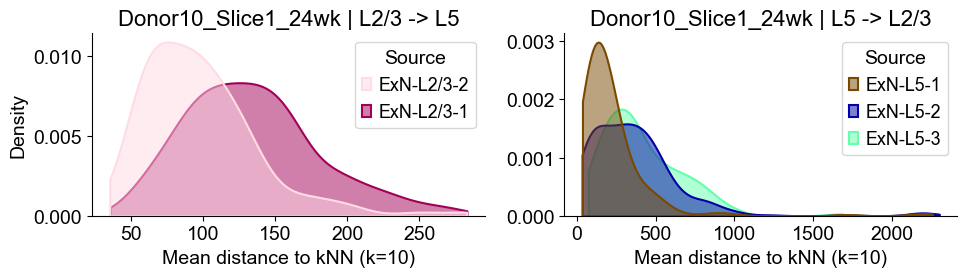
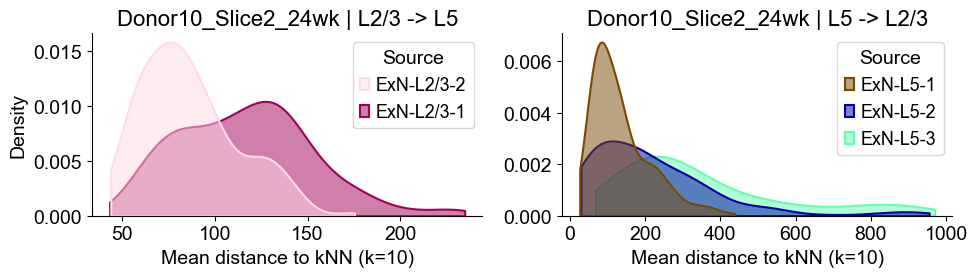
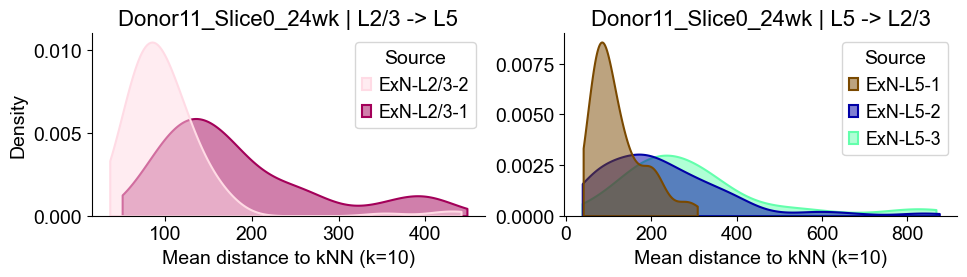
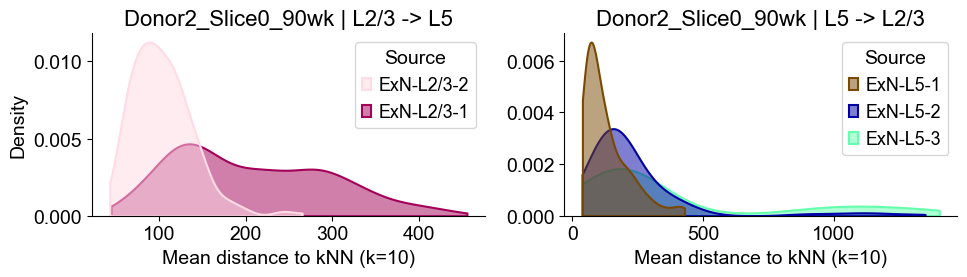
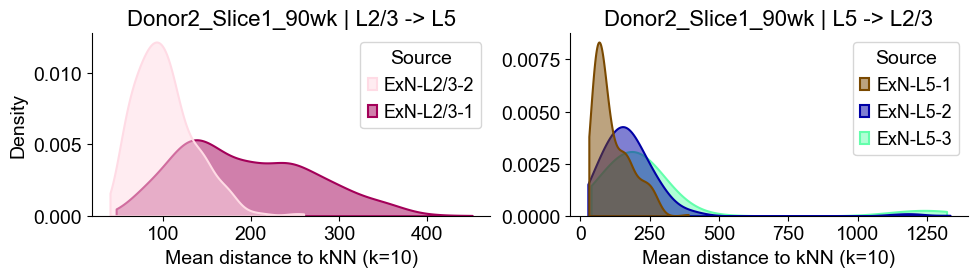
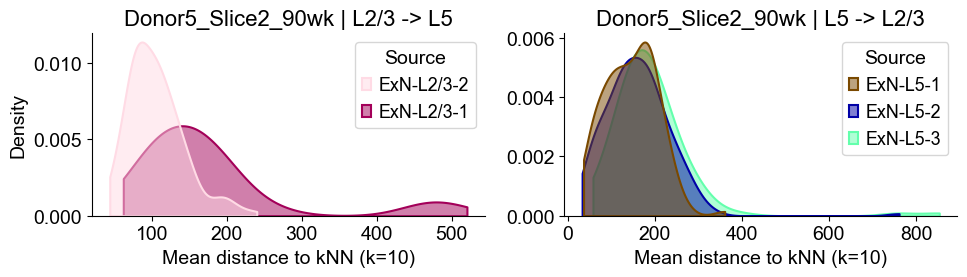
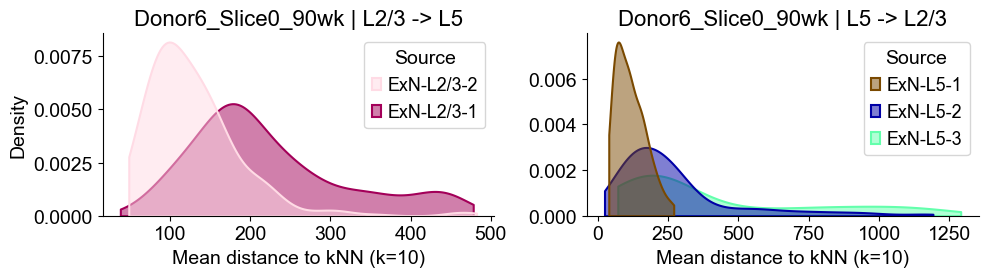
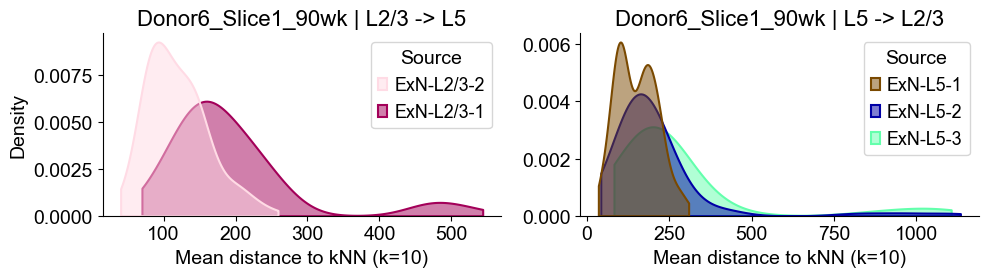
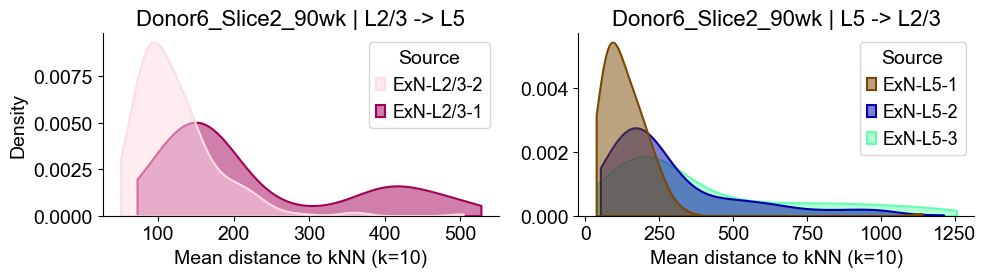
axes2[0].set_title(f"{slice_name_list[i]} | L2/3 -> L5", fontsize=16)
axes2[0].set_xlabel("Mean distance to kNN (k=10)", fontsize=14)
axes2[0].set_ylabel("Density", fontsize=14)
axes2[0].grid(False)
sns.despine(ax=axes2[0], top=True, right=True)
sub_l5 = dist_df[dist_df["group"] == "L5"]
sns.kdeplot(data=sub_l5, x="distance", hue="Source", common_norm=False, fill=True,
alpha=0.5, linewidth=1.5, palette=ct_color_dict, ax=axes2[1], cut=0, bw_adjust=1)
axes2[1].set_title(f"{slice_name_list[i]} | L5 -> L2/3", fontsize=16)
axes2[1].set_xlabel("Mean distance to kNN (k=10)", fontsize=14)
axes2[1].set_ylabel("Density", fontsize=14)
axes2[1].set_ylabel("")
axes2[1].grid(False)
sns.despine(ax=axes2[1], top=True, right=True)
plt.tight_layout()
plt.show()
Donor1_Slice0_4wk
Donor4_Slice0_4wk
Donor4_Slice1_4wk
Donor4_Slice2_4wk
Donor7_Slice0_4wk
Donor7_Slice1_4wk
Donor7_Slice2_4wk
Donor8_Slice0_4wk
Donor8_Slice1_4wk
Donor8_Slice2_4wk
Donor10_Slice0_24wk
Donor10_Slice1_24wk
Donor10_Slice2_24wk
Donor11_Slice0_24wk
Donor11_Slice1_24wk
Donor11_Slice2_24wk
Donor12_Slice0_24wk
Donor12_Slice1_24wk
Donor2_Slice0_90wk
Donor2_Slice1_90wk
Donor3_Slice0_90wk
Donor3_Slice1_90wk
Donor5_Slice0_90wk
Donor5_Slice1_90wk
Donor5_Slice2_90wk
Donor6_Slice0_90wk
Donor6_Slice1_90wk
Donor6_Slice2_90wk
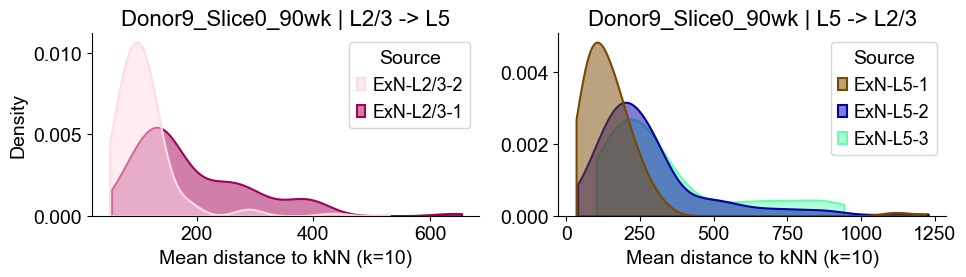
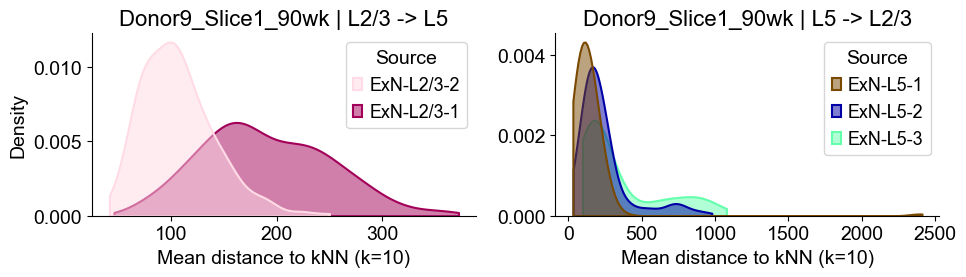
Donor9_Slice0_90wk
Donor9_Slice1_90wk
Donor9_Slice2_90wk
Distances from Layer 2/3 ExNs subtypes to Layer 5 ExNs
[18]:
np.random.seed(1234)
def add_jitter(x, scale=0.1):
    return x + np.random.normal(0, scale, size=len(x))
[19]:
fig, axes = plt.subplots(1, 2, figsize=(7, 3))

data_dict = dist_map_l23.copy()
src_cts = [key for key in data_dict.keys()]
data_list = [data_dict[key] for key in data_dict.keys()]
palette = [ct_color_dict[key] for key in data_dict.keys()]
x_pos = np.arange(len(data_dict.keys()))

for s in range(2):
    sns.boxplot(data=data_list, ax=axes[s], showfliers=False, palette=palette, width=0.7, medianprops={"color": "red",})
    if s == 1:
        for i, scores in enumerate(data_list):
            axes[s].scatter(add_jitter(np.full(len(scores), x_pos[i])), scores, facecolors='white', edgecolors='black', alpha=0.8, s=20, zorder=2)
    axes[s].set_xticks(x_pos)
    axes[s].set_xticklabels(src_cts, rotation=0, ha='center', fontsize=12)
    axes[s].tick_params(axis='y', labelsize=12)
    axes[s].set_ylabel("Distances", fontsize=12)
    axes[s].set_title("Distance to target cell type", fontsize=16)
    axes[s].spines['top'].set_visible(False)
    axes[s].spines['right'].set_visible(False)
    axes[s].grid(False)

plt.tight_layout()
plt.show()
[20]:
from statannotations.Annotator import Annotator

fig, axes = plt.subplots(1, 2, figsize=(7, 3.5))

data_dict = dist_map_l23.copy()
src_cts = [key for key in data_dict.keys()]
data_list = [data_dict[key] for key in src_cts]
palette = [ct_color_dict[key] for key in src_cts]
x_pos = np.arange(len(src_cts))

vals1 = np.asarray(data_list[0])
vals2 = np.asarray(data_list[1])

df_plot = pd.DataFrame({'distances': np.concatenate([vals1, vals2]),
                        'src_cts': [src_cts[0]]*len(vals1) + [src_cts[1]]*len(vals2)})
colors = [ct_color_dict[src_cts[0]], ct_color_dict[src_cts[1]]]

for s in range(2):
    sns.boxplot(data=df_plot, x='src_cts', y='distances', ax=axes[s], showfliers=False, palette=palette, width=0.7, medianprops={"color": "red",})
    if s == 1:
        for i, scores in enumerate(data_list):
            axes[s].scatter(add_jitter(np.full(len(scores), x_pos[i])), scores, facecolors='white', edgecolors='black', alpha=0.8, s=20, zorder=2)

    pairs = [(src_cts[0], src_cts[1])]
    annot = Annotator(axes[s], pairs, data=df_plot, x='src_cts', y='distances')
    annot.configure(test='Wilcoxon', text_format='full', loc='inside', verbose=0, fontsize=14,)
    annot.apply_and_annotate()

    axes[s].set_xticks(x_pos)
    axes[s].set_xticklabels(src_cts, rotation=0, ha='center', fontsize=12)
    axes[s].tick_params(axis='y', labelsize=12)
    axes[s].set_xlabel(None)
    axes[s].set_ylabel("Distances", fontsize=12)
    axes[s].set_title("Distance to target cell type", fontsize=16)
    axes[s].spines['top'].set_visible(False)
    axes[s].spines['right'].set_visible(False)
    axes[s].grid(False)

plt.tight_layout()
plt.show()
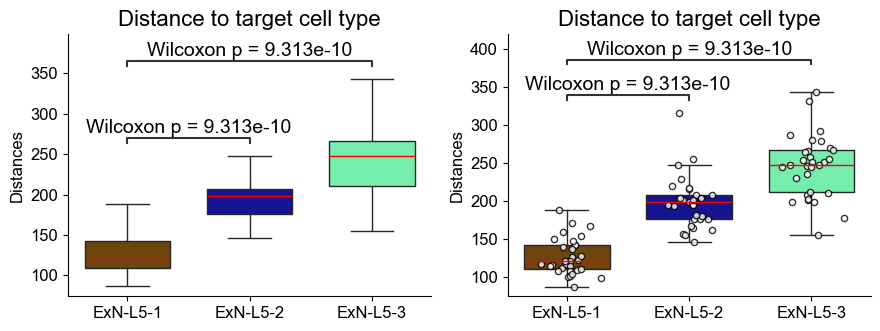
Distances from Layer 5 ExNs subtypes to Layer 2/3 ExNs
[21]:
fig, axes = plt.subplots(1, 2, figsize=(8, 3))

data_dict = dist_map_l5.copy()
src_cts = [key for key in data_dict.keys()]
data_list = [data_dict[key] for key in data_dict.keys()]
palette = [ct_color_dict[key] for key in data_dict.keys()]
x_pos = np.arange(len(data_dict.keys()))

for s in range(2):
    sns.boxplot(data=data_list, ax=axes[s], showfliers=False, palette=palette, width=0.8, medianprops={"color": "red",})
    if s == 1:
        for i, scores in enumerate(data_list):
            axes[s].scatter(add_jitter(np.full(len(scores), x_pos[i])), scores, facecolors='white', edgecolors='black', alpha=0.8, s=20, zorder=2)
    axes[s].set_xticks(x_pos)
    axes[s].set_xticklabels(src_cts, rotation=0, ha='center', fontsize=12)
    axes[s].tick_params(axis='y', labelsize=12)
    axes[s].set_ylabel("Distances", fontsize=12)
    axes[s].set_title("Distance to target cell type", fontsize=16)
    axes[s].spines['top'].set_visible(False)
    axes[s].spines['right'].set_visible(False)
    axes[s].grid(False)

plt.tight_layout()
plt.show()
[22]:
fig, axes = plt.subplots(1, 2, figsize=(9, 3.5))

data_dict = dist_map_l5.copy()
src_cts = [key for key in data_dict.keys()]
data_list = [data_dict[key] for key in src_cts]
palette = [ct_color_dict[key] for key in src_cts]
x_pos = np.arange(len(src_cts))

vals1 = np.asarray(data_list[0])
vals2 = np.asarray(data_list[1])
vals3 = np.asarray(data_list[2])

df_plot = pd.DataFrame({'distances': np.concatenate([vals1, vals2, vals3]),
                        'src_cts': [src_cts[0]]*len(vals1) + [src_cts[1]]*len(vals2) + [src_cts[2]]*len(vals3)})
colors = [ct_color_dict[src_cts[0]], ct_color_dict[src_cts[1]], ct_color_dict[src_cts[2]]]

for s in range(2):
    sns.boxplot(data=df_plot, x='src_cts', y='distances', ax=axes[s], showfliers=False, palette=palette, width=0.7, medianprops={"color": "red",})
    if s == 1:
        for i, scores in enumerate(data_list):
            axes[s].scatter(add_jitter(np.full(len(scores), x_pos[i])), scores, facecolors='white', edgecolors='black', alpha=0.8, s=20, zorder=2)

    pairs = [(src_cts[0], src_cts[1]), (src_cts[0], src_cts[2])]
    annot = Annotator(axes[s], pairs, data=df_plot, x='src_cts', y='distances')
    annot.configure(test='Wilcoxon', text_format='full', loc='inside', verbose=0, fontsize=14,)
    annot.apply_and_annotate()

    axes[s].set_xticks(x_pos)
    axes[s].set_xticklabels(src_cts, rotation=0, ha='center', fontsize=12)
    axes[s].tick_params(axis='y', labelsize=12)
    axes[s].set_xlabel(None)
    axes[s].set_ylabel("Distances", fontsize=12)
    axes[s].set_title("Distance to target cell type", fontsize=16)
    axes[s].spines['top'].set_visible(False)
    axes[s].spines['right'].set_visible(False)
    axes[s].grid(False)

plt.tight_layout()
plt.show()
Differential expression analysis
[23]:
# # genes to exclude that included bit 40 in their code, which had very low signal
# bad_genes = ['Prom1', 'Parp8', 'Rbpj', 'Skap2', 'Ago3', 'Cntnap3', 'Meis2', 'Arnt2', 'Hivep2', 'Foxn3', 'Parp2', 'Zfp608', 'Fbxl7', 'Htr2c',
#              'Klf7', 'Timp2', 'Zbtb16', 'Egflam', 'Ikzf2', 'Cdh13', 'Cd63', 'Marcks', 'Parp11', 'Herc6', 'Cdh9', 'Tsc22d1', 'Lef1', 'Shisa6',
#              'St8sia6', 'Trp53', 'Plch1', 'Cp', '9630014M24Rik', 'Elf2', 'Tafa1', 'Ntn1', 'Rarb', 'Zfp462', 'Sirt5', 'Mamdc2', 'Bach2']
[24]:
adata_concat_copy = adata_concat.copy()
# adata_concat_copy = adata_concat_copy[:, [gene for gene in adata_concat_copy.var_names if gene not in bad_genes]].copy()
sc.pp.normalize_total(adata_concat_copy, target_sum=250)
sc.pp.log1p(adata_concat_copy)
sc.pp.scale(adata_concat_copy, max_value=10)

sc.tl.pca(adata_concat_copy, n_comps=50, random_state=1234)
# sc.external.pp.harmony_integrate(adata_concat_copy, key='slice_name', random_state=1234)
# sc.pp.neighbors(adata_concat_copy, use_rep="X_pca_harmony", n_neighbors=15, n_pcs=50, random_state=1234)
sc.pp.neighbors(adata_concat_copy, use_rep="X_pca", n_neighbors=15, n_pcs=50, random_state=1234)
sc.tl.umap(adata_concat_copy, random_state=1234)#, min_dist=0.1)

adata_concat.obsm['X_pca'] = adata_concat_copy.obsm['X_pca'].copy()
adata_concat.obsm['X_umap'] = adata_concat_copy.obsm['X_umap'].copy()
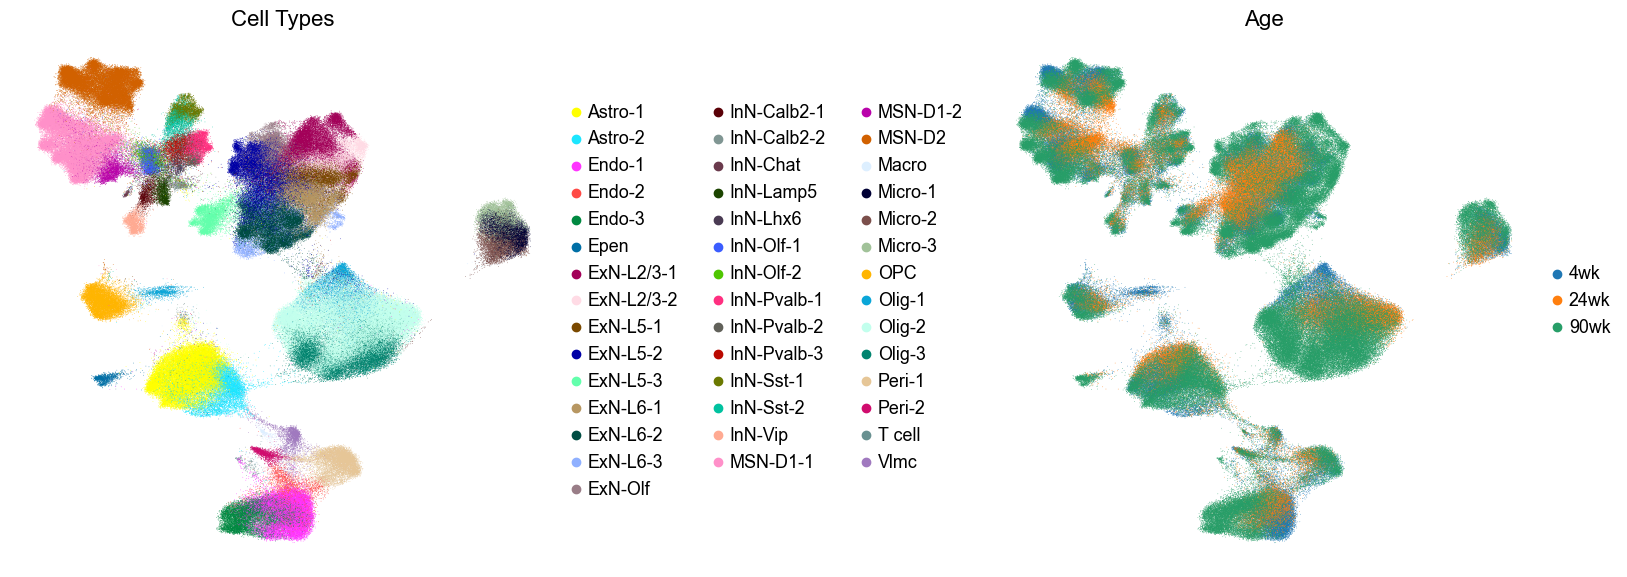
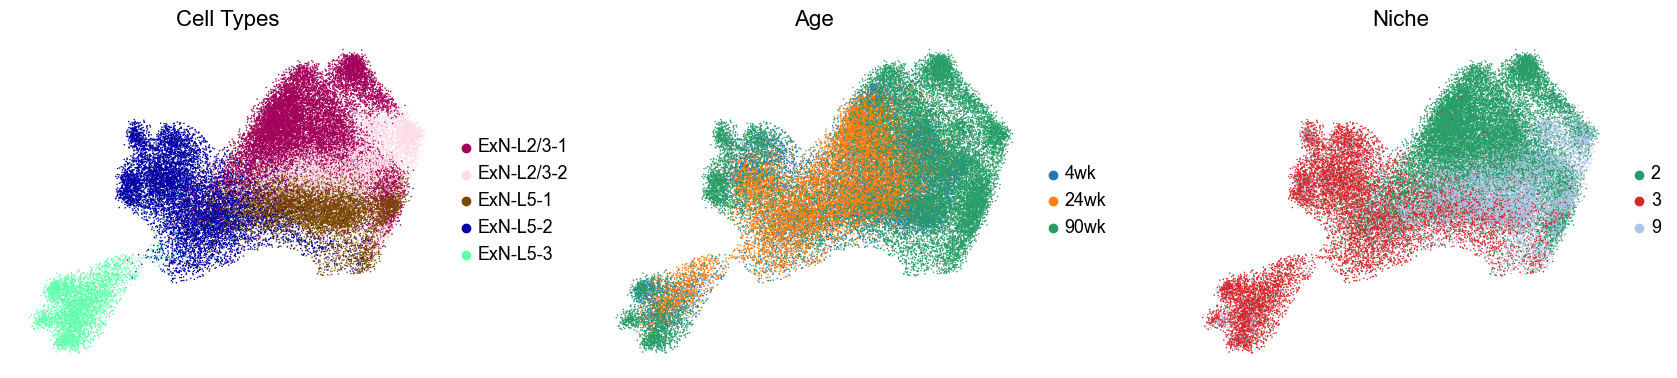
[25]:
fig, axes = plt.subplots(1, 2, figsize=(16.5, 6))

sc.pl.umap(adata_concat_copy, color='celltype_43', palette=ct_color_dict, s=1, frameon=False,
           title='Cell Types', ax=axes[0], show=False)
axes[0].set_title('Cell Types', fontsize=16)

sc.pl.umap(adata_concat_copy, color='age', s=1, frameon=False,
           title='Age', ax=axes[1], show=False)
axes[1].set_title('Age', fontsize=16)

plt.tight_layout()
plt.show()
[26]:
noi_list = ['2', '3', '9']
ctoi_list = ['ExN-L2/3-1', 'ExN-L2/3-2', 'ExN-L5-1', 'ExN-L5-2', 'ExN-L5-3']
adata_sub = adata_concat[adata_concat.obs['matched_cluster'].isin(noi_list) & adata_concat.obs['celltype_43'].isin(ctoi_list)].copy()
sc.pp.normalize_total(adata_sub, target_sum=250)
sc.pp.log1p(adata_sub)

adata_sub_4wk = adata_sub[adata_sub.obs['age'] == '4wk'].copy()
adata_sub_24wk = adata_sub[adata_sub.obs['age'] == '24wk'].copy()
adata_sub_90wk = adata_sub[adata_sub.obs['age'] == '90wk'].copy()
[27]:
sc.tl.rank_genes_groups(adata_sub_4wk, groupby='celltype_43', method="wilcoxon", pts=True)
res_4wk = adata_sub_4wk.uns["rank_genes_groups"]
sc.tl.rank_genes_groups(adata_sub_24wk, groupby='celltype_43', method="wilcoxon", pts=True)
res_24wk = adata_sub_24wk.uns["rank_genes_groups"]
sc.tl.rank_genes_groups(adata_sub_90wk, groupby='celltype_43', method="wilcoxon", pts=True)
res_90wk = adata_sub_90wk.uns["rank_genes_groups"]
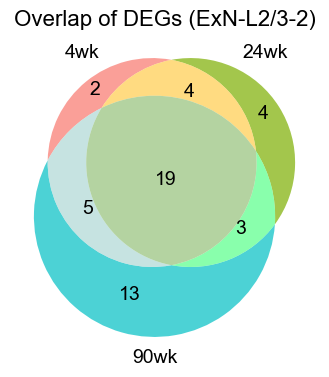
ExN-L2/3-2
[28]:
logfc_cutoff = 0.2
qval_cutoff = 0.05
pts_cutoff = 0.3

ctoi = 'ExN-L2/3-2'

### 4wk
genes = pd.Index(res_4wk["names"][ctoi], name="gene")
pts_series = res_4wk["pts"][ctoi]
pts_aligned = pts_series.reindex(genes)

df_4wk = pd.DataFrame({
    "gene": res_4wk["names"][ctoi],
    "logFC": res_4wk["logfoldchanges"][ctoi],
    "pval": res_4wk["pvals"][ctoi],
    "qval": res_4wk["pvals_adj"][ctoi],
    "pts": pts_aligned.values,
})

deg_4wk = df_4wk[(df_4wk["qval"] < qval_cutoff) & (df_4wk["logFC"] > logfc_cutoff) & (df_4wk["pts"] > pts_cutoff)].copy()
print(f"4wk: {deg_4wk.shape[0]} upregulated genes in {ctoi}")
print(deg_4wk.head())

### 24wk
genes = pd.Index(res_24wk["names"][ctoi], name="gene")
pts_series = res_24wk["pts"][ctoi]
pts_aligned = pts_series.reindex(genes)

df_24wk = pd.DataFrame({
    "gene": res_24wk["names"][ctoi],
    "logFC": res_24wk["logfoldchanges"][ctoi],
    "pval": res_24wk["pvals"][ctoi],
    "qval": res_24wk["pvals_adj"][ctoi],
    "pts": pts_aligned.values,
})

deg_24wk = df_24wk[(df_24wk["qval"] < qval_cutoff) & (df_24wk["logFC"] > logfc_cutoff) & (df_24wk["pts"] > pts_cutoff)].copy()
print(f"24wk: {deg_24wk.shape[0]} upregulated genes in {ctoi}")
print(deg_24wk.head())

### 90wk
genes = pd.Index(res_90wk["names"][ctoi], name="gene")
pts_series = res_90wk["pts"][ctoi]
pts_aligned = pts_series.reindex(genes)

df_90wk = pd.DataFrame({
    "gene": res_90wk["names"][ctoi],
    "logFC": res_90wk["logfoldchanges"][ctoi],
    "pval": res_90wk["pvals"][ctoi],
    "qval": res_90wk["pvals_adj"][ctoi],
    "pts": pts_aligned.values,
})

deg_90wk = df_90wk[(df_90wk["qval"] < qval_cutoff) & (df_90wk["logFC"] > logfc_cutoff) & (df_90wk["pts"] > pts_cutoff)].copy()
print(f"90wk: {deg_90wk.shape[0]} upregulated genes in {ctoi}")
print(deg_90wk.head())

### plot
plt.figure(figsize=(4, 4))

set_4wk  = set(deg_4wk["gene"])
set_24wk = set(deg_24wk["gene"])
set_90wk = set(deg_90wk["gene"])

v = venn3(
    [set_4wk, set_24wk, set_90wk],
    set_labels=("4wk", "24wk", "90wk"),
    set_colors=("#F8766D", "#7CAE00", "#00BFC4"),
    alpha=0.7,
)

for text in v.set_labels:
    if text:
        text.set_fontsize(14)
        text.set_color("black")

for text in v.subset_labels:
    if text:
        text.set_fontsize(14)
        text.set_color("black")

plt.title(f"Overlap of DEGs ({ctoi})", fontsize=16)
plt.tight_layout()
plt.show()
4wk: 30 upregulated genes in ExN-L2/3-2
    gene     logFC           pval           qval       pts
0  Cpne9  1.962348  7.763249e-307  2.903455e-304  0.791339
1   Rorb  2.202378  2.658569e-252  4.971525e-250  0.674705
2  Exph5  1.857414  5.729557e-210  7.142847e-208  0.668799
3   Cux2  1.544550  2.489910e-181  2.328066e-179  0.765748
4  Mef2c  0.952400  1.079385e-143  8.073800e-142  0.876476
24wk: 30 upregulated genes in ExN-L2/3-2
    gene     logFC           pval           qval       pts
0  Cpne9  1.990597  1.001443e-201  3.745399e-199  0.689675
1   Rorb  2.311778  1.544606e-178  2.888413e-176  0.586994
2   Cux2  1.392535  2.699313e-100   3.365144e-98  0.634912
3  Exph5  1.849394   4.585358e-97   4.287310e-95  0.476326
4  Rspo1  2.427774   1.567706e-86   1.172644e-84  0.380491
90wk: 40 upregulated genes in ExN-L2/3-2
     gene     logFC           pval           qval       pts
0    Rorb  2.834739   0.000000e+00   0.000000e+00  0.716210
1   Rspo1  3.143565   0.000000e+00   0.000000e+00  0.615328
2   Cpne9  1.846399   0.000000e+00   0.000000e+00  0.795054
3   Exph5  1.351381   0.000000e+00   0.000000e+00  0.814398
4  Scube1  1.428674  1.336926e-267  1.000020e-265  0.668217
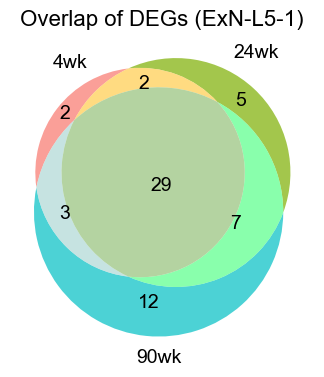
ExN-L5-1
[29]:
logfc_cutoff = 0.2
qval_cutoff = 0.05
pts_cutoff = 0.3

ctoi = 'ExN-L5-1'

### 4wk
genes = pd.Index(res_4wk["names"][ctoi], name="gene")
pts_series = res_4wk["pts"][ctoi]
pts_aligned = pts_series.reindex(genes)

df_4wk = pd.DataFrame({
    "gene": res_4wk["names"][ctoi],
    "logFC": res_4wk["logfoldchanges"][ctoi],
    "pval": res_4wk["pvals"][ctoi],
    "qval": res_4wk["pvals_adj"][ctoi],
    "pts": pts_aligned.values,
})

deg_4wk = df_4wk[(df_4wk["qval"] < qval_cutoff) & (df_4wk["logFC"] > logfc_cutoff) & (df_4wk["pts"] > pts_cutoff)].copy()
print(f"4wk: {deg_4wk.shape[0]} upregulated genes in {ctoi}")
print(deg_4wk.head())

### 24wk
genes = pd.Index(res_24wk["names"][ctoi], name="gene")
pts_series = res_24wk["pts"][ctoi]
pts_aligned = pts_series.reindex(genes)

df_24wk = pd.DataFrame({
    "gene": res_24wk["names"][ctoi],
    "logFC": res_24wk["logfoldchanges"][ctoi],
    "pval": res_24wk["pvals"][ctoi],
    "qval": res_24wk["pvals_adj"][ctoi],
    "pts": pts_aligned.values,
})

deg_24wk = df_24wk[(df_24wk["qval"] < qval_cutoff) & (df_24wk["logFC"] > logfc_cutoff) & (df_24wk["pts"] > pts_cutoff)].copy()
print(f"24wk: {deg_24wk.shape[0]} upregulated genes in {ctoi}")
print(deg_24wk.head())

### 90wk
genes = pd.Index(res_90wk["names"][ctoi], name="gene")
pts_series = res_90wk["pts"][ctoi]
pts_aligned = pts_series.reindex(genes)

df_90wk = pd.DataFrame({
    "gene": res_90wk["names"][ctoi],
    "logFC": res_90wk["logfoldchanges"][ctoi],
    "pval": res_90wk["pvals"][ctoi],
    "qval": res_90wk["pvals_adj"][ctoi],
    "pts": pts_aligned.values,
})

deg_90wk = df_90wk[(df_90wk["qval"] < qval_cutoff) & (df_90wk["logFC"] > logfc_cutoff) & (df_90wk["pts"] > pts_cutoff)].copy()
print(f"90wk: {deg_90wk.shape[0]} upregulated genes in {ctoi}")
print(deg_90wk.head())

### plot
plt.figure(figsize=(4, 4))

set_4wk  = set(deg_4wk["gene"])
set_24wk = set(deg_24wk["gene"])
set_90wk = set(deg_90wk["gene"])

v = venn3(
    [set_4wk, set_24wk, set_90wk],
    set_labels=("4wk", "24wk", "90wk"),
    set_colors=("#F8766D", "#7CAE00", "#00BFC4"),
    alpha=0.7,
)

for text in v.set_labels:
    if text:
        text.set_fontsize(14)
        text.set_color("black")

for text in v.subset_labels:
    if text:
        text.set_fontsize(14)
        text.set_color("black")

plt.title(f"Overlap of DEGs ({ctoi})", fontsize=16)
plt.tight_layout()
plt.show()
4wk: 36 upregulated genes in ExN-L5-1
      gene     logFC           pval           qval       pts
0   Scube1  2.298638   0.000000e+00   0.000000e+00  0.871019
1  Slc24a3  2.184667   0.000000e+00   0.000000e+00  0.645223
2   Deptor  1.978385  1.589211e-182  9.906079e-181  0.495860
3   Kcnip3  1.130002  2.024673e-179  1.081754e-177  0.756688
4    Sulf2  1.062571  2.937525e-169  1.373293e-167  0.902229
24wk: 43 upregulated genes in ExN-L5-1
      gene     logFC           pval           qval       pts
0   Scube1  2.231177  1.315021e-259  4.918177e-257  0.673059
1  Slc24a3  2.618641  2.816292e-257  5.266467e-255  0.607109
2   Kcnip3  1.287465  2.818858e-150  2.635632e-148  0.778297
3    Sulf2  1.207236  3.899368e-139  2.916727e-137  0.883536
4   Deptor  2.113511  9.764905e-108  5.217250e-106  0.418148
90wk: 51 upregulated genes in ExN-L5-1
      gene     logFC           pval           qval       pts
0   Deptor  2.630691   0.000000e+00   0.000000e+00  0.692334
1   Scube1  2.136334   0.000000e+00   0.000000e+00  0.768652
2  Slc24a3  2.339453   0.000000e+00   0.000000e+00  0.649897
3    Sulf2  1.469752   0.000000e+00   0.000000e+00  0.880903
4   Kcnip3  1.327483  2.402683e-307  1.283719e-305  0.851814
[30]:
celltype_keep = ['ExN-L2/3-1', 'ExN-L2/3-2', 'ExN-L5-1', 'ExN-L5-2', 'ExN-L5-3']
top_n = 10
qval_cutoff = 0.05
logfc_cutoff = 0.02
pts_cutoff = 0.3
figsize = (13, 4)
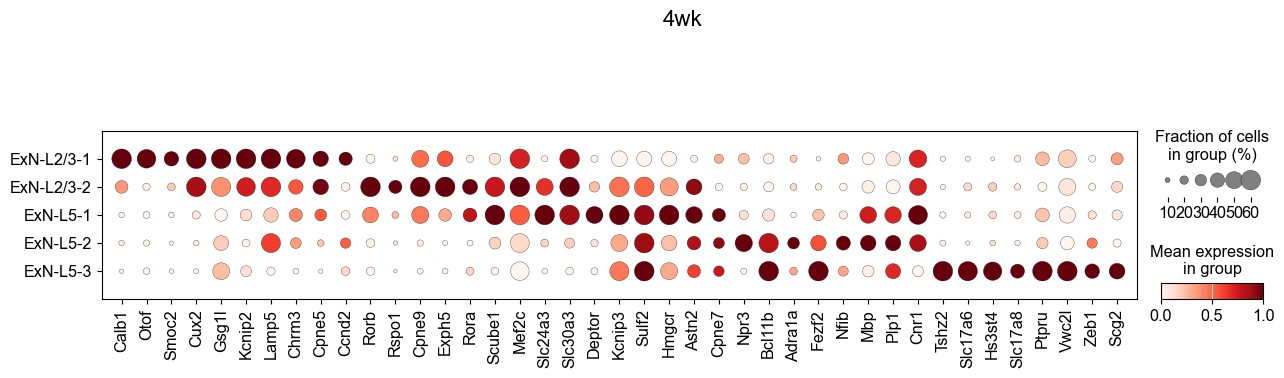
### 4wk
# top_genes_by_ct_4wk = {ct: list(res_4wk["names"][ct][:top_n]) for ct in celltype_keep}
top_genes_by_ct_4wk = {}
for ct in celltype_keep:
genes = pd.Index(res_4wk["names"][ct], name="gene")
pts_series = res_4wk["pts"][ct]
pts_aligned = pts_series.reindex(genes)
df = pd.DataFrame({
"gene": res_4wk["names"][ct],
"logFC": res_4wk["logfoldchanges"][ct],
"qval": res_4wk["pvals_adj"][ct],
"score": res_4wk["scores"][ct],
"pts": pts_aligned.values,
})
df = df[(df["qval"] < qval_cutoff) & (df["logFC"] > logfc_cutoff) & (df["pts"] > pts_cutoff)]
df = df.sort_values("logFC", ascending=False)
top_genes_by_ct_4wk[ct] = df["gene"].head(top_n).tolist()
gene_list = []
seen = set()
for ct in celltype_keep:
for g in top_genes_by_ct_4wk[ct]:
if g not in seen:
gene_list.append(g)
seen.add(g)
fig, ax = plt.subplots(figsize=figsize)
sc.pl.dotplot(
adata_sub_4wk,
var_names=gene_list,
groupby="celltype_43",
standard_scale="var",
dot_max=0.6,
ax=ax,
show=False,
# cmap="RdBu_r",
)
ax.set_title("4wk", fontsize=16)
plt.tight_layout()
plt.show()
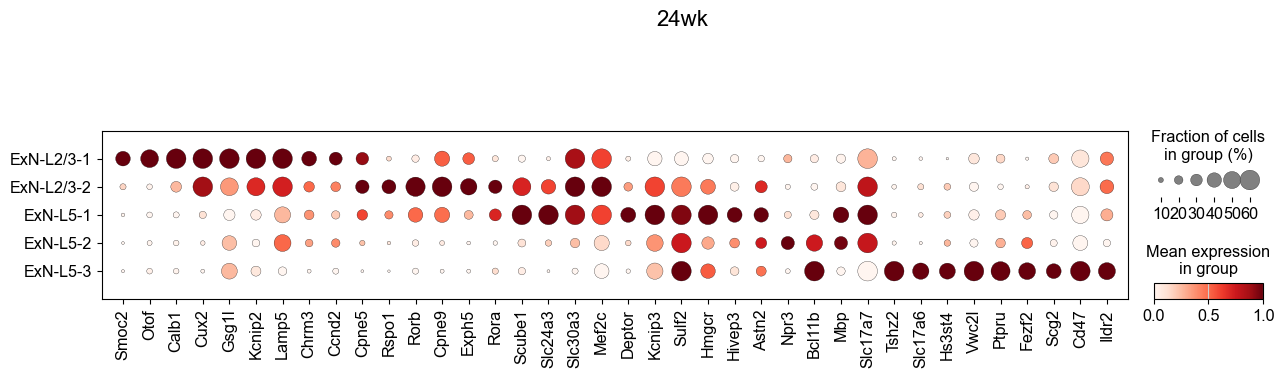
### 24wk
# top_genes_by_ct_24wk = {ct: list(res_24wk["names"][ct][:top_n]) for ct in celltype_keep}
top_genes_by_ct_24wk = {}
for ct in celltype_keep:
genes = pd.Index(res_24wk["names"][ct], name="gene")
pts_series = res_24wk["pts"][ct]
pts_aligned = pts_series.reindex(genes)
df = pd.DataFrame({
"gene": res_24wk["names"][ct],
"logFC": res_24wk["logfoldchanges"][ct],
"qval": res_24wk["pvals_adj"][ct],
"score": res_24wk["scores"][ct],
"pts": pts_aligned.values,
})
df = df[(df["qval"] < qval_cutoff) & (df["logFC"] > logfc_cutoff) & (df["pts"] > pts_cutoff)]
df = df.sort_values("logFC", ascending=False)
top_genes_by_ct_24wk[ct] = df["gene"].head(top_n).tolist()
gene_list = []
seen = set()
for ct in celltype_keep:
for g in top_genes_by_ct_24wk[ct]:
if g not in seen:
gene_list.append(g)
seen.add(g)
fig, ax = plt.subplots(figsize=figsize)
sc.pl.dotplot(
adata_sub_24wk,
var_names=gene_list,
groupby="celltype_43",
standard_scale="var",
dot_max=0.6,
ax=ax,
show=False,
# cmap="RdBu_r",
)
ax.set_title("24wk", fontsize=16)
plt.tight_layout()
plt.show()
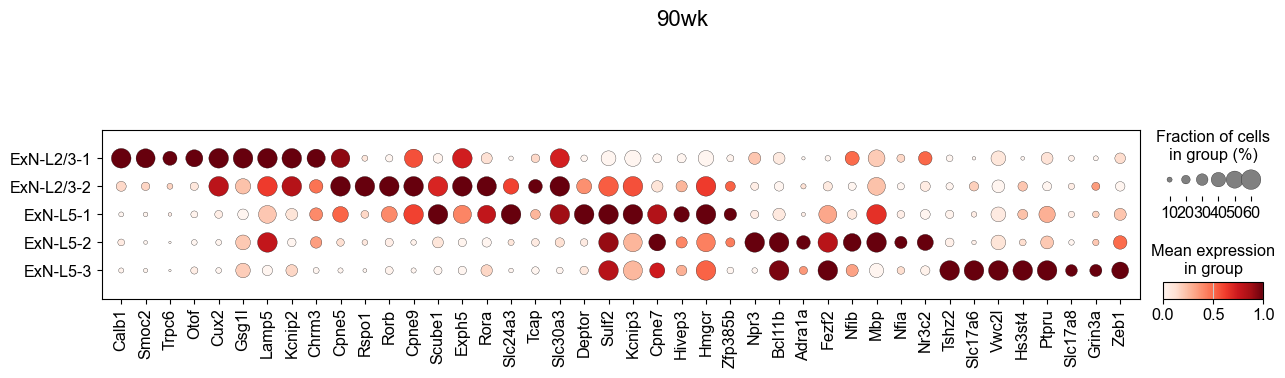
### 90wk
# top_genes_by_ct_90wk = {ct: list(res_90wk["names"][ct][:top_n]) for ct in celltype_keep}
top_genes_by_ct_90wk = {}
for ct in celltype_keep:
genes = pd.Index(res_90wk["names"][ct], name="gene")
pts_series = res_90wk["pts"][ct]
pts_aligned = pts_series.reindex(genes)
df = pd.DataFrame({
"gene": res_90wk["names"][ct],
"logFC": res_90wk["logfoldchanges"][ct],
"qval": res_90wk["pvals_adj"][ct],
"score": res_90wk["scores"][ct],
"pts": pts_aligned.values,
})
df = df[(df["qval"] < qval_cutoff) & (df["logFC"] > logfc_cutoff) & (df["pts"] > pts_cutoff)]
df = df.sort_values("logFC", ascending=False)
top_genes_by_ct_90wk[ct] = df["gene"].head(top_n).tolist()
gene_list = []
seen = set()
for ct in celltype_keep:
for g in top_genes_by_ct_90wk[ct]:
if g not in seen:
gene_list.append(g)
seen.add(g)
fig, ax = plt.subplots(figsize=figsize)
sc.pl.dotplot(
adata_sub_90wk,
var_names=gene_list,
groupby="celltype_43",
standard_scale="var",
dot_max=0.6,
ax=ax,
show=False,
# cmap="RdBu_r",
)
ax.set_title("90wk", fontsize=16)
plt.tight_layout()
plt.show()
[46]:
from sklearn.neighbors import NearestNeighbors
X_sub = adata_sub.obsm['X_umap']
k = 100
nbrs = NearestNeighbors(n_neighbors=k).fit(X_sub)
dists, _ = nbrs.kneighbors(X_sub)
knn_dist = dists[:, -1]
threshold = np.quantile(knn_dist, 0.97)
keep_ct = knn_dist <= threshold
keep_mask = np.ones(adata_sub.n_obs, dtype=bool)
keep_mask[:] = keep_ct
adata_sub_clean = adata_sub[keep_mask].copy()
print(f"Filtered out {adata_sub.n_obs - adata_sub_clean.n_obs}/{adata_sub.n_obs} cells as outliers based on kNN distance.")
s = 5
fig, axes = plt.subplots(1, 3, figsize=(17, 4))
sc.pl.umap(adata_sub_clean, color='celltype_43', palette=ct_color_dict, s=s, frameon=False,
title='Cell Types', ax=axes[0], show=False)
axes[0].set_title('Cell Types', fontsize=16)
sc.pl.umap(adata_sub_clean, color='age', s=s, frameon=False,
title='Age', ax=axes[1], show=False)
axes[1].set_title('Age', fontsize=16)
sc.pl.umap(adata_sub_clean, color='matched_cluster', s=s, frameon=False, palette=niche_color_dict,
title='Niche', ax=axes[2], show=False)
axes[2].set_title('Niche', fontsize=16)
plt.tight_layout()
plt.show()
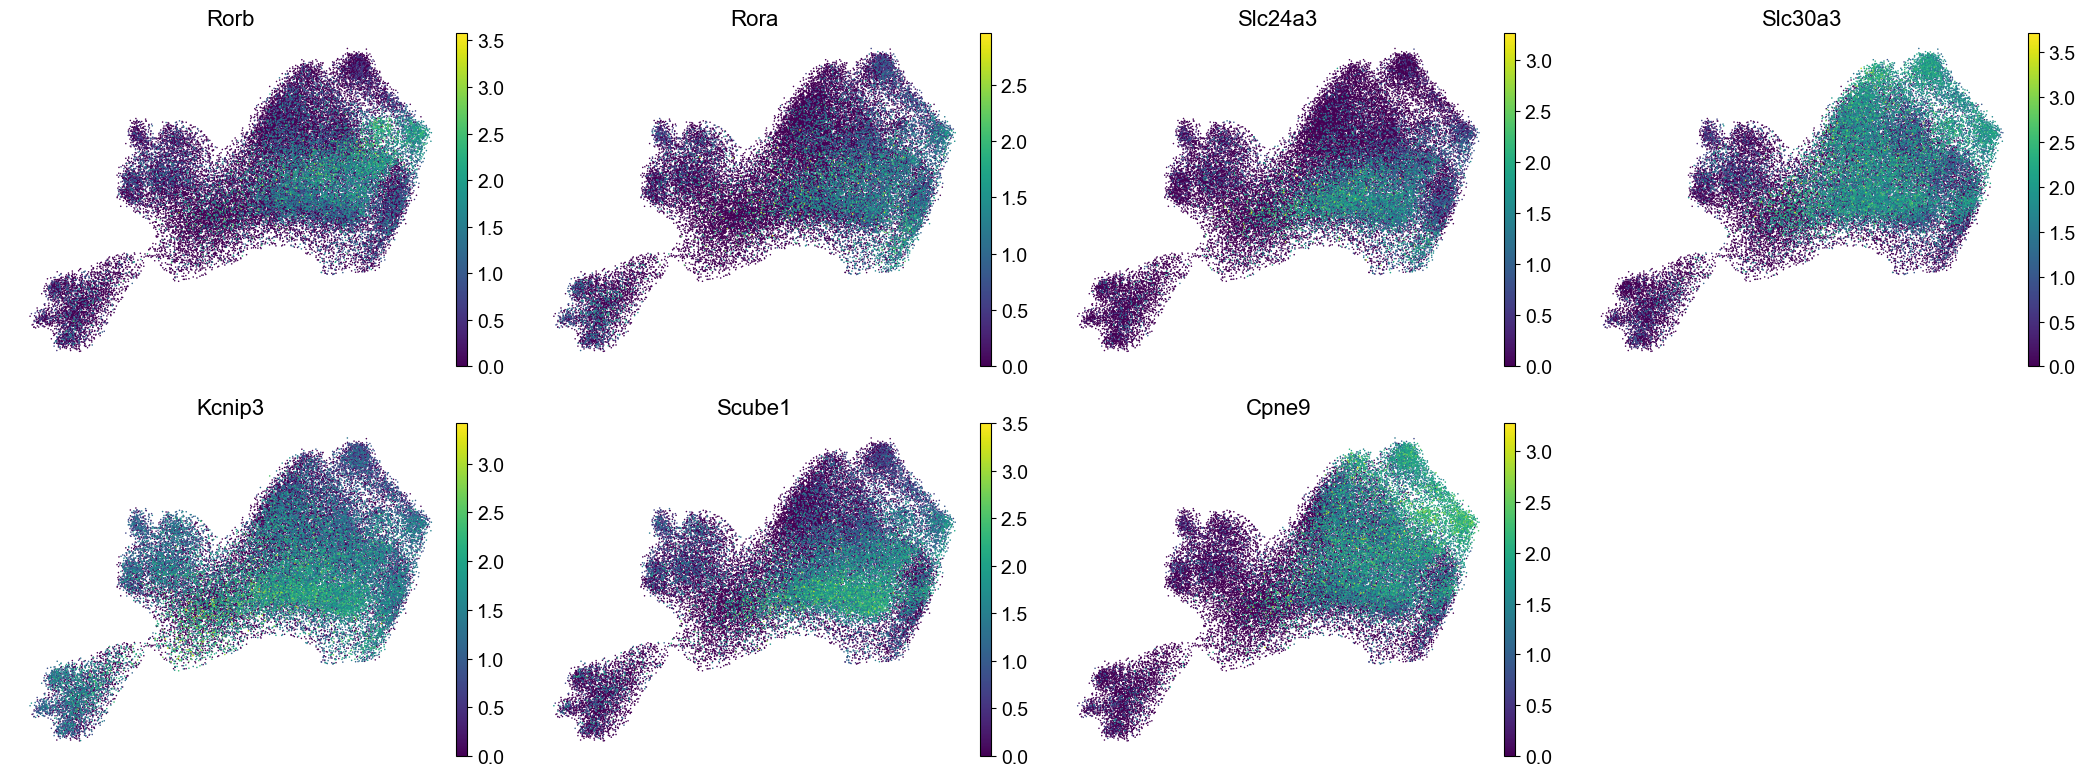
genes_to_plot = ['Rorb', 'Rora', 'Slc24a3', 'Slc30a3', 'Kcnip3', 'Scube1', 'Cpne9']
n_col = 4
n_row = int(np.ceil(len(genes_to_plot) / n_col))
fig, axes = plt.subplots(n_row, n_col, figsize=(5 * n_col + 1, 4 * n_row))
axes = axes.flatten()
for i, gene in enumerate(genes_to_plot):
sc.pl.umap(adata_sub_clean, color=gene, s=s, frameon=False, ax=axes[i], show=False)#, vmax=2.5)
axes[i].set_title(gene, fontsize=16)
for j in range(i + 1, n_row * n_col):
axes[j].axis('off')
plt.tight_layout()
plt.show()
Filtered out 1366/45517 cells as outliers based on kNN distance.
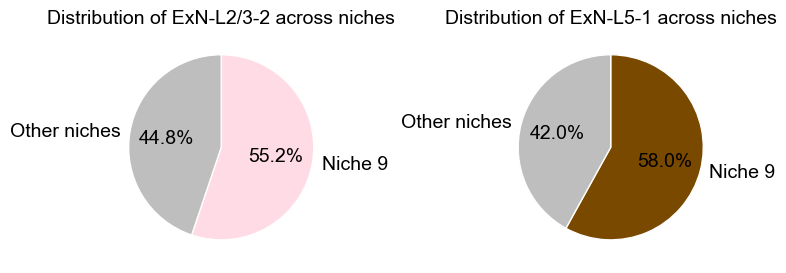
Distribution of cells across niches
[47]:
fig, axes = plt.subplots(1, 2, figsize=(8, 4))

# ExN-L2/3-2
mask = adata_concat_copy.obs["celltype_43"] == "ExN-L2/3-2"
obs_ct = adata_concat_copy.obs.loc[mask]

n_niche9 = (obs_ct["matched_cluster"] == "9").sum()
n_other  = (obs_ct["matched_cluster"] != "9").sum()

sizes = [n_niche9, n_other]
labels = ["Niche 9", "Other niches"]

axes[0].pie(
    sizes,
    labels=labels,
    colors=[ct_color_dict["ExN-L2/3-2"], "#BEBEBE"],
    autopct="%.1f%%",
    startangle=90,
    counterclock=False,
    wedgeprops=dict(edgecolor="white", linewidth=1)
)
axes[0].set_title("Distribution of ExN-L2/3-2 across niches", fontsize=14,)


# ExN-L5-1
mask = adata_concat_copy.obs["celltype_43"] == "ExN-L5-1"
obs_ct = adata_concat_copy.obs.loc[mask]

n_niche9 = (obs_ct["matched_cluster"] == "9").sum()
n_other  = (obs_ct["matched_cluster"] != "9").sum()

sizes = [n_niche9, n_other]

axes[1].pie(
    sizes,
    labels=labels,
    colors=[ct_color_dict["ExN-L5-1"], "#BEBEBE"],
    autopct="%.1f%%",
    startangle=90,
    counterclock=False,
    wedgeprops=dict(edgecolor="white", linewidth=1),
)
axes[1].set_title("Distribution of ExN-L5-1 across niches", fontsize=14,)

plt.tight_layout()
plt.show()
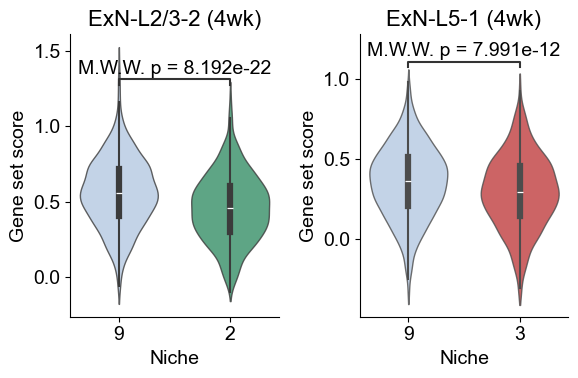
Scoring age and cell type-specific gene sets
4wk
[48]:
from scipy.stats import mannwhitneyu
from statannotations.Annotator import Annotator

### 4wk
top_n = 10
top_genes_by_ct_4wk = {}
for ct in celltype_keep:
    genes = pd.Index(res_4wk["names"][ct], name="gene")
    pts_series = res_4wk["pts"][ct]
    pts_aligned = pts_series.reindex(genes)
    df = pd.DataFrame({
        "gene": res_4wk["names"][ct],
        "logFC": res_4wk["logfoldchanges"][ct],
        "qval": res_4wk["pvals_adj"][ct],
        "score": res_4wk["scores"][ct],
        "pts": pts_aligned.values,
    })
    df = df[(df["qval"] < qval_cutoff) & (df["logFC"] > logfc_cutoff) & (df["pts"] > pts_cutoff)]
    df = df.sort_values("logFC", ascending=False)
    top_genes_by_ct_4wk[ct] = df["gene"].head(top_n).tolist()


### scoring
l232_4wk_marker_genes = top_genes_by_ct_4wk['ExN-L2/3-2']
l51_4wk_marker_genes = top_genes_by_ct_4wk['ExN-L5-1']
print("ExN-L2/3-2 marker genes (4wk):", l232_4wk_marker_genes)
print("ExN-L5-1 marker genes (4wk):", l51_4wk_marker_genes)

sc.tl.score_genes(adata_sub_4wk, gene_list=l232_4wk_marker_genes, score_name="ExN-L2/3-2_program_score", use_raw=False, random_state=1234)
sc.tl.score_genes(adata_sub_4wk, gene_list=l51_4wk_marker_genes, score_name="ExN-L5-1_program_score", use_raw=False, random_state=1234)

df_l232 = adata_sub_4wk.obs[
    (adata_sub_4wk.obs["celltype_43"] == "ExN-L2/3-2") &
    (adata_sub_4wk.obs["matched_cluster"].isin(["9", "2"]))
][["matched_cluster", "ExN-L2/3-2_program_score"]]

df_l51 = adata_sub_4wk.obs[
    (adata_sub_4wk.obs["celltype_43"] == "ExN-L5-1") &
    (adata_sub_4wk.obs["matched_cluster"].isin(["9", "3"]))
][["matched_cluster", "ExN-L5-1_program_score"]]


### plot
fig, axes = plt.subplots(1, 2, figsize=(6, 4))

sns.violinplot(data=df_l232, x="matched_cluster", y="ExN-L2/3-2_program_score", order=["9", "2"],
               palette={"9": niche_color_dict["9"], "2": niche_color_dict["2"]},
               inner="box", cut=1, scale="width",  width=0.7, linewidth=1, ax=axes[0], alpha=0.8)
pairs = [("9", "2")]
annotator = Annotator(axes[0], pairs, data=df_l232, x="matched_cluster", y="ExN-L2/3-2_program_score", order=["9", "2"])
annotator.configure(test='Mann-Whitney', text_format='full', loc='inside', verbose=0)
annotator.apply_and_annotate()

axes[0].set_title("ExN-L2/3-2 (4wk)", fontsize=16)
axes[0].set_xlabel("Niche", fontsize=14)
axes[0].set_ylabel("Gene set score", fontsize=14)
axes[0].tick_params(axis='x', labelsize=14)
axes[0].tick_params(axis='y', labelsize=14)

axes[0].grid(False)
sns.despine(ax=axes[0], top=True, right=True)

sns.violinplot(data=df_l51, x="matched_cluster", y="ExN-L5-1_program_score", order=["9", "3"],
               palette={"9": niche_color_dict["9"], "3": niche_color_dict["3"]},
               inner="box", cut=1, scale="width", width=0.7, linewidth=1, ax=axes[1], alpha=0.8)

pairs = [("9", "3")]
annotator = Annotator(axes[1], pairs, data=df_l51, x="matched_cluster", y="ExN-L5-1_program_score", order=["9", "3"])
annotator.configure(test='Mann-Whitney', text_format='full', loc='inside', verbose=0)
annotator.apply_and_annotate()

axes[1].set_title("ExN-L5-1 (4wk)", fontsize=16)
axes[1].set_xlabel("Niche", fontsize=14)
axes[1].set_ylabel("Gene set score", fontsize=14)
axes[1].tick_params(axis='x', labelsize=14)
axes[1].tick_params(axis='y', labelsize=14)

axes[1].grid(False)
sns.despine(ax=axes[1], top=True, right=True)

plt.tight_layout()
plt.show()
ExN-L2/3-2 marker genes (4wk): ['Rorb', 'Rspo1', 'Cpne9', 'Exph5', 'Cux2', 'Rora', 'Scube1', 'Mef2c', 'Slc24a3', 'Slc30a3']
ExN-L5-1 marker genes (4wk): ['Scube1', 'Slc24a3', 'Deptor', 'Kcnip3', 'Sulf2', 'Rora', 'Hmgcr', 'Astn2', 'Cpne7', 'Rorb']
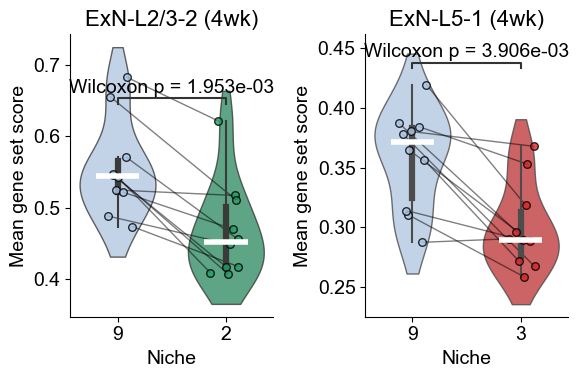
[49]:
from scipy.stats import wilcoxon

slice_key = "slice_name"
x_key = "matched_cluster"

df_l232_slice = adata_sub_4wk.obs.loc[
    (adata_sub_4wk.obs["celltype_43"] == "ExN-L2/3-2") &
    (adata_sub_4wk.obs[x_key].isin(["9", "2"])),
    [slice_key, x_key, "ExN-L2/3-2_program_score"]
].copy()

df_l51_slice = adata_sub_4wk.obs.loc[
    (adata_sub_4wk.obs["celltype_43"] == "ExN-L5-1") &
    (adata_sub_4wk.obs[x_key].isin(["9", "3"])),
    [slice_key, x_key, "ExN-L5-1_program_score"]
].copy()

l232_means = df_l232_slice.groupby([slice_key, x_key], observed=True)["ExN-L2/3-2_program_score"].mean().unstack(x_key)
l232_means = l232_means.dropna(subset=["9", "2"])
l232_long = l232_means.reset_index().melt(id_vars=slice_key, value_vars=["9", "2"],
                                          var_name='matched_cluster', value_name="Mean gene set score")

l51_means = df_l51_slice.groupby([slice_key, x_key], observed=True)["ExN-L5-1_program_score"].mean().unstack(x_key)
l51_means = l51_means.dropna(subset=["9", "3"])
l51_long = l51_means.reset_index().melt(id_vars=slice_key, value_vars=["9", "3"],
                                        var_name='matched_cluster', value_name="Mean gene set score")

W_l232, p_l232 = wilcoxon(l232_means["9"], l232_means["2"], alternative="two-sided", zero_method="wilcox")
W_l51, p_l51 = wilcoxon(l51_means["9"], l51_means["3"], alternative="two-sided", zero_method="wilcox")


### plot
fig, axes = plt.subplots(1, 2, figsize=(6, 4))

sns.violinplot(data=l232_long, x="matched_cluster", y="Mean gene set score", order=["9", "2"],
               palette={"9": niche_color_dict["9"], "2": niche_color_dict["2"]},
               inner="box", cut=1, scale="width", width=0.7, linewidth=1, ax=axes[0], alpha=0.8)
# sns.boxplot(data=l232_long, x="matched_cluster", y="Mean gene set score", order=["9", "2"],
#             palette={"9": niche_color_dict["9"], "2": niche_color_dict["2"]},
#             width=0.7, showfliers=False, ax=axes[0], zorder=0, boxprops=dict(alpha=0.8))

pairs = [("9", "2")]
annotator = Annotator(axes[0], pairs, data=l232_long, x="matched_cluster", y="Mean gene set score", order=["9", "2"])
annotator.configure(test=None, text_format="full", loc="inside", verbose=0)
annotator.set_custom_annotations([f"Wilcoxon p = {p_l232:.3e}"])
annotator.annotate()
# annotator.configure(test='Wilcoxon', text_format='full', loc='inside', verbose=0)
# annotator.apply_and_annotate()

vals_9 = l232_means["9"].values
vals_2 = l232_means["2"].values
n = len(vals_9)
for xpos, vals in zip([0, 1],[vals_9, vals_2]):
    axes[0].hlines(np.median(vals), xpos-0.2, xpos+0.2,color='white', lw=4, zorder=3)
jitter = 0.15
for k in range(n):
    x1 = 0 + np.random.uniform(-jitter, jitter)
    x2 = 1 + np.random.uniform(-jitter, jitter)
    y1, y2 = vals_9[k], vals_2[k]
    axes[0].plot([x1, x2], [y1, y2], color='black', linewidth=1, alpha=0.5, zorder=1)
    axes[0].scatter([x1], [y1], color=niche_color_dict['9'], s=30, alpha=0.8, edgecolor='black', zorder=2)
    axes[0].scatter([x2], [y2], color=niche_color_dict['2'], s=30, alpha=0.8, edgecolor='black', zorder=2)

axes[0].set_title("ExN-L2/3-2 (4wk)", fontsize=16)
axes[0].set_xlabel("Niche", fontsize=14)
axes[0].set_ylabel("Mean gene set score", fontsize=14)
axes[0].tick_params(axis='x', labelsize=14)
axes[0].tick_params(axis='y', labelsize=14)

axes[0].grid(False)
sns.despine(ax=axes[0], top=True, right=True)

sns.violinplot(data=l51_long, x="matched_cluster", y="Mean gene set score", order=["9", "3"],
               palette={"9": niche_color_dict["9"], "3": niche_color_dict["3"]},
               inner="box", cut=1, scale="width", width=0.7, linewidth=1, ax=axes[1], alpha=0.8)
# sns.boxplot(data=l51_long, x="matched_cluster", y="Mean gene set score", order=["9", "3"],
#             palette={"9": niche_color_dict["9"], "3": niche_color_dict["3"]},
#             width=0.7, showfliers=False, ax=axes[1], zorder=0, boxprops=dict(alpha=0.8))

pairs = [("9", "3")]
annotator = Annotator(axes[1], pairs, data=l51_long, x="matched_cluster", y="Mean gene set score", order=["9", "3"])
annotator.configure(test=None, text_format="full", loc="inside", verbose=0)
annotator.set_custom_annotations([f"Wilcoxon p = {p_l51:.3e}"])
annotator.annotate()
# annotator.configure(test='Wilcoxon', text_format='full', loc='inside', verbose=0)
# annotator.apply_and_annotate()

vals_9 = l51_means["9"].values
vals_3 = l51_means["3"].values
n = len(vals_9)
for xpos, vals in zip([0, 1],[vals_9, vals_3]):
    axes[1].hlines(np.median(vals), xpos-0.2, xpos+0.2,color='white', lw=4, zorder=3)
jitter = 0.15
for k in range(n):
    x1 = 0 + np.random.uniform(-jitter, jitter)
    x2 = 1 + np.random.uniform(-jitter, jitter)
    y1, y2 = vals_9[k], vals_3[k]
    axes[1].plot([x1, x2], [y1, y2], color='black', linewidth=1, alpha=0.5, zorder=1)
    axes[1].scatter([x1], [y1], color=niche_color_dict['9'], s=30, alpha=0.8, edgecolor='black', zorder=2)
    axes[1].scatter([x2], [y2], color=niche_color_dict['3'], s=30, alpha=0.8, edgecolor='black', zorder=2)

axes[1].set_title("ExN-L5-1 (4wk)", fontsize=16)
axes[1].set_xlabel("Niche", fontsize=14)
axes[1].set_ylabel("Mean gene set score", fontsize=14)
axes[1].tick_params(axis='x', labelsize=14)
axes[1].tick_params(axis='y', labelsize=14)

axes[1].grid(False)
sns.despine(ax=axes[1], top=True, right=True)

plt.tight_layout()
plt.show()
24wk
[50]:
### 24wk
top_n = 10
top_genes_by_ct_24wk = {}
for ct in celltype_keep:
genes = pd.Index(res_24wk["names"][ct], name="gene")
pts_series = res_24wk["pts"][ct]
pts_aligned = pts_series.reindex(genes)
df = pd.DataFrame({
"gene": res_24wk["names"][ct],
"logFC": res_24wk["logfoldchanges"][ct],
"qval": res_24wk["pvals_adj"][ct],
"score": res_24wk["scores"][ct],
"pts": pts_aligned.values,
})
df = df[(df["qval"] < qval_cutoff) & (df["logFC"] > logfc_cutoff) & (df["pts"] > pts_cutoff)]
df = df.sort_values("logFC", ascending=False)
top_genes_by_ct_24wk[ct] = df["gene"].head(top_n).tolist()
### scoring
l232_24wk_marker_genes = top_genes_by_ct_24wk['ExN-L2/3-2']
l51_24wk_marker_genes = top_genes_by_ct_24wk['ExN-L5-1']
print("ExN-L2/3-2 marker genes (24wk):", l232_24wk_marker_genes)
print("ExN-L5-1 marker genes (24wk):", l51_24wk_marker_genes)
sc.tl.score_genes(adata_sub_24wk, gene_list=l232_24wk_marker_genes, score_name="ExN-L2/3-2_program_score", use_raw=False, random_state=1234)
sc.tl.score_genes(adata_sub_24wk, gene_list=l51_24wk_marker_genes, score_name="ExN-L5-1_program_score", use_raw=False, random_state=1234)
df_l232 = adata_sub_24wk.obs[
(adata_sub_24wk.obs["celltype_43"] == "ExN-L2/3-2") &
(adata_sub_24wk.obs["matched_cluster"].isin(["9", "2"]))
][["matched_cluster", "ExN-L2/3-2_program_score"]]
df_l51 = adata_sub_24wk.obs[
(adata_sub_24wk.obs["celltype_43"] == "ExN-L5-1") &
(adata_sub_24wk.obs["matched_cluster"].isin(["9", "3"]))
][["matched_cluster", "ExN-L5-1_program_score"]]
### plot
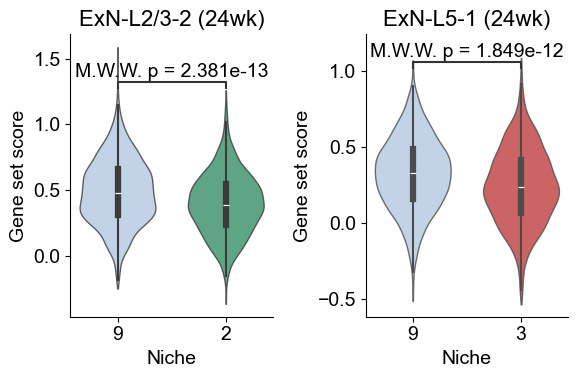
fig, axes = plt.subplots(1, 2, figsize=(6, 4))
sns.violinplot(data=df_l232, x="matched_cluster", y="ExN-L2/3-2_program_score", order=["9", "2"],
palette={"9": niche_color_dict["9"], "2": niche_color_dict["2"]},
inner="box", cut=1, scale="width", width=0.7, linewidth=1, ax=axes[0], alpha=0.8)
pairs = [("9", "2")]
annotator = Annotator(axes[0], pairs, data=df_l232, x="matched_cluster", y="ExN-L2/3-2_program_score", order=["9", "2"])
annotator.configure(test='Mann-Whitney', text_format='full', loc='inside', verbose=0)
annotator.apply_and_annotate()
axes[0].set_title("ExN-L2/3-2 (24wk)", fontsize=16)
axes[0].set_xlabel("Niche", fontsize=14)
axes[0].set_ylabel("Gene set score", fontsize=14)
axes[0].tick_params(axis='x', labelsize=14)
axes[0].tick_params(axis='y', labelsize=14)
axes[0].grid(False)
sns.despine(ax=axes[0], top=True, right=True)
sns.violinplot(data=df_l51, x="matched_cluster", y="ExN-L5-1_program_score", order=["9", "3"],
palette={"9": niche_color_dict["9"], "3": niche_color_dict["3"]},
inner="box", cut=1, scale="width", width=0.7,linewidth=1, ax=axes[1], alpha=0.8)
pairs = [("9", "3")]
annotator = Annotator(axes[1], pairs, data=df_l51, x="matched_cluster", y="ExN-L5-1_program_score", order=["9", "3"])
annotator.configure(test='Mann-Whitney', text_format='full', loc='inside', verbose=0)
annotator.apply_and_annotate()
axes[1].set_title("ExN-L5-1 (24wk)", fontsize=16)
axes[1].set_xlabel("Niche", fontsize=14)
axes[1].set_ylabel("Gene set score", fontsize=14)
axes[1].tick_params(axis='x', labelsize=14)
axes[1].tick_params(axis='y', labelsize=14)
axes[1].grid(False)
sns.despine(ax=axes[1], top=True, right=True)
plt.tight_layout()
plt.show()
ExN-L2/3-2 marker genes (24wk): ['Rspo1', 'Rorb', 'Cpne9', 'Exph5', 'Rora', 'Cux2', 'Scube1', 'Slc24a3', 'Slc30a3', 'Mef2c']
ExN-L5-1 marker genes (24wk): ['Slc24a3', 'Scube1', 'Deptor', 'Kcnip3', 'Sulf2', 'Hmgcr', 'Rora', 'Hivep3', 'Rorb', 'Astn2']
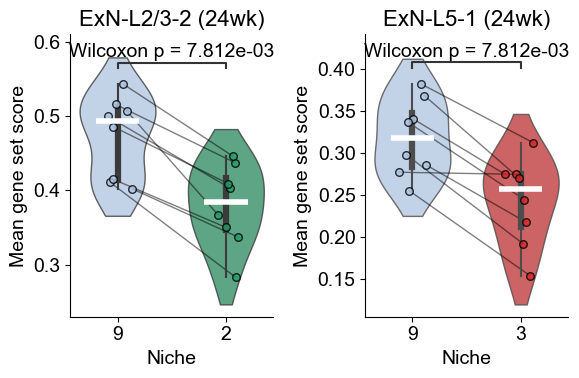
[51]:
slice_key = "slice_name"
x_key = "matched_cluster"

df_l232_slice = adata_sub_24wk.obs.loc[
    (adata_sub_24wk.obs["celltype_43"] == "ExN-L2/3-2") &
    (adata_sub_24wk.obs[x_key].isin(["9", "2"])),
    [slice_key, x_key, "ExN-L2/3-2_program_score"]
].copy()

df_l51_slice = adata_sub_24wk.obs.loc[
    (adata_sub_24wk.obs["celltype_43"] == "ExN-L5-1") &
    (adata_sub_24wk.obs[x_key].isin(["9", "3"])),
    [slice_key, x_key, "ExN-L5-1_program_score"]
].copy()

l232_means = df_l232_slice.groupby([slice_key, x_key], observed=True)["ExN-L2/3-2_program_score"].mean().unstack(x_key)
l232_means = l232_means.dropna(subset=["9", "2"])
l232_long = l232_means.reset_index().melt(id_vars=slice_key, value_vars=["9", "2"],
                                          var_name='matched_cluster', value_name="Mean gene set score")

l51_means = df_l51_slice.groupby([slice_key, x_key], observed=True)["ExN-L5-1_program_score"].mean().unstack(x_key)
l51_means = l51_means.dropna(subset=["9", "3"])
l51_long = l51_means.reset_index().melt(id_vars=slice_key, value_vars=["9", "3"],
                                        var_name='matched_cluster', value_name="Mean gene set score")

W_l232, p_l232 = wilcoxon(l232_means["9"], l232_means["2"], alternative="two-sided", zero_method="wilcox")
W_l51, p_l51 = wilcoxon(l51_means["9"], l51_means["3"], alternative="two-sided", zero_method="wilcox")


### plot
fig, axes = plt.subplots(1, 2, figsize=(6, 4))

sns.violinplot(data=l232_long, x="matched_cluster", y="Mean gene set score", order=["9", "2"],
               palette={"9": niche_color_dict["9"], "2": niche_color_dict["2"]},
               inner="box", cut=1, scale="width", width=0.7, linewidth=1, ax=axes[0], alpha=0.8)
# sns.boxplot(data=l232_long, x="matched_cluster", y="Mean gene set score", order=["9", "2"],
#             palette={"9": niche_color_dict["9"], "2": niche_color_dict["2"]},
#             width=0.7, showfliers=False, ax=axes[0], zorder=0, boxprops=dict(alpha=0.8))

pairs = [("9", "2")]
annotator = Annotator(axes[0], pairs, data=l232_long, x="matched_cluster", y="Mean gene set score", order=["9", "2"])
annotator.configure(test=None, text_format="full", loc="inside", verbose=0)
annotator.set_custom_annotations([f"Wilcoxon p = {p_l232:.3e}"])
annotator.annotate()
# annotator.configure(test='Wilcoxon', text_format='full', loc='inside', verbose=0)
# annotator.apply_and_annotate()

vals_9 = l232_means["9"].values
vals_2 = l232_means["2"].values
n = len(vals_9)
for xpos, vals in zip([0, 1],[vals_9, vals_2]):
    axes[0].hlines(np.median(vals), xpos-0.2, xpos+0.2,color='white', lw=4, zorder=3)
jitter = 0.15
for k in range(n):
    x1 = 0 + np.random.uniform(-jitter, jitter)
    x2 = 1 + np.random.uniform(-jitter, jitter)
    y1, y2 = vals_9[k], vals_2[k]
    axes[0].plot([x1, x2], [y1, y2], color='black', linewidth=1, alpha=0.5, zorder=1)
    axes[0].scatter([x1], [y1], color=niche_color_dict['9'], s=30, alpha=0.8, edgecolor='black', zorder=2)
    axes[0].scatter([x2], [y2], color=niche_color_dict['2'], s=30, alpha=0.8, edgecolor='black', zorder=2)

axes[0].set_title("ExN-L2/3-2 (24wk)", fontsize=16)
axes[0].set_xlabel("Niche", fontsize=14)
axes[0].set_ylabel("Mean gene set score", fontsize=14)
axes[0].tick_params(axis='x', labelsize=14)
axes[0].tick_params(axis='y', labelsize=14)

axes[0].grid(False)
sns.despine(ax=axes[0], top=True, right=True)

sns.violinplot(data=l51_long, x="matched_cluster", y="Mean gene set score", order=["9", "3"],
               palette={"9": niche_color_dict["9"], "3": niche_color_dict["3"]},
               inner="box", cut=1, scale="width", width=0.7, linewidth=1, ax=axes[1], alpha=0.8)
# sns.boxplot(data=l51_long, x="matched_cluster", y="Mean gene set score", order=["9", "3"],
#             palette={"9": niche_color_dict["9"], "3": niche_color_dict["3"]},
#             width=0.7, showfliers=False, ax=axes[1], zorder=0, boxprops=dict(alpha=0.8))

pairs = [("9", "3")]
annotator = Annotator(axes[1], pairs, data=l51_long, x="matched_cluster", y="Mean gene set score", order=["9", "3"])
annotator.configure(test=None, text_format="full", loc="inside", verbose=0)
annotator.set_custom_annotations([f"Wilcoxon p = {p_l51:.3e}"])
annotator.annotate()
# annotator.configure(test='Wilcoxon', text_format='full', loc='inside', verbose=0)
# annotator.apply_and_annotate()

vals_9 = l51_means["9"].values
vals_3 = l51_means["3"].values
n = len(vals_9)
for xpos, vals in zip([0, 1],[vals_9, vals_3]):
    axes[1].hlines(np.median(vals), xpos-0.2, xpos+0.2,color='white', lw=4, zorder=3)
jitter = 0.15
for k in range(n):
    x1 = 0 + np.random.uniform(-jitter, jitter)
    x2 = 1 + np.random.uniform(-jitter, jitter)
    y1, y2 = vals_9[k], vals_3[k]
    axes[1].plot([x1, x2], [y1, y2], color='black', linewidth=1, alpha=0.5, zorder=1)
    axes[1].scatter([x1], [y1], color=niche_color_dict['9'], s=30, alpha=0.8, edgecolor='black', zorder=2)
    axes[1].scatter([x2], [y2], color=niche_color_dict['3'], s=30, alpha=0.8, edgecolor='black', zorder=2)

axes[1].set_title("ExN-L5-1 (24wk)", fontsize=16)
axes[1].set_xlabel("Niche", fontsize=14)
axes[1].set_ylabel("Mean gene set score", fontsize=14)
axes[1].tick_params(axis='x', labelsize=14)
axes[1].tick_params(axis='y', labelsize=14)

axes[1].grid(False)
sns.despine(ax=axes[1], top=True, right=True)

plt.tight_layout()
plt.show()
90wk
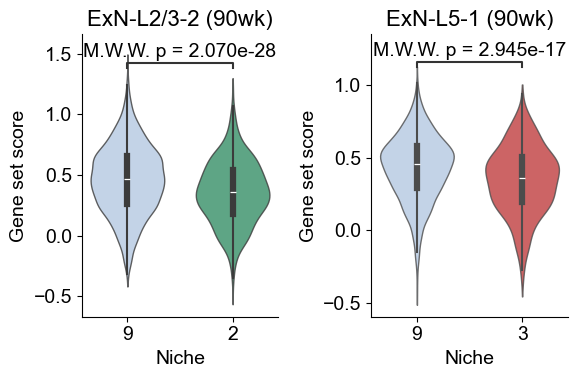
[52]:
### 90wk
top_n = 10
top_genes_by_ct_90wk = {}
for ct in celltype_keep:
    genes = pd.Index(res_90wk["names"][ct], name="gene")
    pts_series = res_90wk["pts"][ct]
    pts_aligned = pts_series.reindex(genes)
    df = pd.DataFrame({
        "gene": res_90wk["names"][ct],
        "logFC": res_90wk["logfoldchanges"][ct],
        "qval": res_90wk["pvals_adj"][ct],
        "score": res_90wk["scores"][ct],
        "pts": pts_aligned.values,
    })
    df = df[(df["qval"] < qval_cutoff) & (df["logFC"] > logfc_cutoff) & (df["pts"] > pts_cutoff)]
    df = df.sort_values("logFC", ascending=False)
    top_genes_by_ct_90wk[ct] = df["gene"].head(top_n).tolist()


### scoring
l232_90wk_marker_genes = top_genes_by_ct_90wk['ExN-L2/3-2']
l51_90wk_marker_genes = top_genes_by_ct_90wk['ExN-L5-1']
print("ExN-L2/3-2 marker genes (90wk):", l232_90wk_marker_genes)
print("ExN-L5-1 marker genes (90wk):", l51_90wk_marker_genes)

sc.tl.score_genes(adata_sub_90wk, gene_list=l232_90wk_marker_genes, score_name="ExN-L2/3-2_program_score", use_raw=False, random_state=1234)
sc.tl.score_genes(adata_sub_90wk, gene_list=l51_90wk_marker_genes, score_name="ExN-L5-1_program_score", use_raw=False, random_state=1234)

df_l232 = adata_sub_90wk.obs[
    (adata_sub_90wk.obs["celltype_43"] == "ExN-L2/3-2") &
    (adata_sub_90wk.obs["matched_cluster"].isin(["9", "2"]))
][["matched_cluster", "ExN-L2/3-2_program_score"]]

df_l51 = adata_sub_90wk.obs[
    (adata_sub_90wk.obs["celltype_43"] == "ExN-L5-1") &
    (adata_sub_90wk.obs["matched_cluster"].isin(["9", "3"]))
][["matched_cluster", "ExN-L5-1_program_score"]]


### plot
fig, axes = plt.subplots(1, 2, figsize=(6, 4))

sns.violinplot(data=df_l232, x="matched_cluster", y="ExN-L2/3-2_program_score", order=["9", "2"],
               palette={"9": niche_color_dict["9"], "2": niche_color_dict["2"]},
               inner="box", cut=1, scale="width",  width=0.7, linewidth=1, ax=axes[0], alpha=0.8)
pairs = [("9", "2")]
annotator = Annotator(axes[0], pairs, data=df_l232, x="matched_cluster", y="ExN-L2/3-2_program_score", order=["9", "2"])
annotator.configure(test='Mann-Whitney', text_format='full', loc='inside', verbose=0)
annotator.apply_and_annotate()

axes[0].set_title("ExN-L2/3-2 (90wk)", fontsize=16)
axes[0].set_xlabel("Niche", fontsize=14)
axes[0].set_ylabel("Gene set score", fontsize=14)
axes[0].tick_params(axis='x', labelsize=14)
axes[0].tick_params(axis='y', labelsize=14)

axes[0].grid(False)
sns.despine(ax=axes[0], top=True, right=True)

sns.violinplot(data=df_l51, x="matched_cluster", y="ExN-L5-1_program_score", order=["9", "3"],
               palette={"9": niche_color_dict["9"], "3": niche_color_dict["3"]},
               inner="box", cut=1, scale="width", width=0.7, linewidth=1, ax=axes[1], alpha=0.8)

pairs = [("9", "3")]
annotator = Annotator(axes[1], pairs, data=df_l51, x="matched_cluster", y="ExN-L5-1_program_score", order=["9", "3"])
annotator.configure(test='Mann-Whitney', text_format='full', loc='inside', verbose=0)
annotator.apply_and_annotate()

axes[1].set_title("ExN-L5-1 (90wk)", fontsize=16)
axes[1].set_xlabel("Niche", fontsize=14)
axes[1].set_ylabel("Gene set score", fontsize=14)
axes[1].tick_params(axis='x', labelsize=14)
axes[1].tick_params(axis='y', labelsize=14)

axes[1].grid(False)
sns.despine(ax=axes[1], top=True, right=True)

plt.tight_layout()
plt.show()
ExN-L2/3-2 marker genes (90wk): ['Rspo1', 'Rorb', 'Cpne9', 'Scube1', 'Exph5', 'Rora', 'Slc24a3', 'Tcap', 'Slc30a3', 'Cux2']
ExN-L5-1 marker genes (90wk): ['Deptor', 'Slc24a3', 'Scube1', 'Sulf2', 'Kcnip3', 'Cpne7', 'Hivep3', 'Hmgcr', 'Zfp385b', 'Rora']
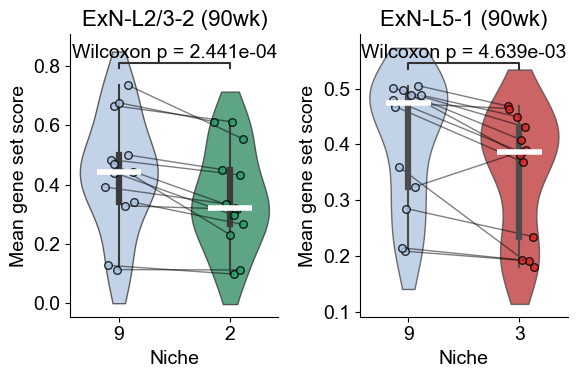
[53]:
slice_key = "slice_name"
x_key = "matched_cluster"

df_l232_slice = adata_sub_90wk.obs.loc[
    (adata_sub_90wk.obs["celltype_43"] == "ExN-L2/3-2") &
    (adata_sub_90wk.obs[x_key].isin(["9", "2"])),
    [slice_key, x_key, "ExN-L2/3-2_program_score"]
].copy()

df_l51_slice = adata_sub_90wk.obs.loc[
    (adata_sub_90wk.obs["celltype_43"] == "ExN-L5-1") &
    (adata_sub_90wk.obs[x_key].isin(["9", "3"])),
    [slice_key, x_key, "ExN-L5-1_program_score"]
].copy()

l232_means = df_l232_slice.groupby([slice_key, x_key], observed=True)["ExN-L2/3-2_program_score"].mean().unstack(x_key)
l232_means = l232_means.dropna(subset=["9", "2"])
l232_long = l232_means.reset_index().melt(id_vars=slice_key, value_vars=["9", "2"],
                                          var_name='matched_cluster', value_name="Mean gene set score")

l51_means = df_l51_slice.groupby([slice_key, x_key], observed=True)["ExN-L5-1_program_score"].mean().unstack(x_key)
l51_means = l51_means.dropna(subset=["9", "3"])
l51_long = l51_means.reset_index().melt(id_vars=slice_key, value_vars=["9", "3"],
                                        var_name='matched_cluster', value_name="Mean gene set score")

W_l232, p_l232 = wilcoxon(l232_means["9"], l232_means["2"], alternative="two-sided", zero_method="wilcox")
W_l51, p_l51 = wilcoxon(l51_means["9"], l51_means["3"], alternative="two-sided", zero_method="wilcox")


### plot
fig, axes = plt.subplots(1, 2, figsize=(6, 4))

sns.violinplot(data=l232_long, x="matched_cluster", y="Mean gene set score", order=["9", "2"],
               palette={"9": niche_color_dict["9"], "2": niche_color_dict["2"]},
               inner="box", cut=1, scale="width", width=0.7, linewidth=1, ax=axes[0], alpha=0.8)
# sns.boxplot(data=l232_long, x="matched_cluster", y="Mean gene set score", order=["9", "2"],
#             palette={"9": niche_color_dict["9"], "2": niche_color_dict["2"]},
#             width=0.7, showfliers=False, ax=axes[0], zorder=0, boxprops=dict(alpha=0.8))

pairs = [("9", "2")]
annotator = Annotator(axes[0], pairs, data=l232_long, x="matched_cluster", y="Mean gene set score", order=["9", "2"])
annotator.configure(test=None, text_format="full", loc="inside", verbose=0)
annotator.set_custom_annotations([f"Wilcoxon p = {p_l232:.3e}"])
annotator.annotate()
# annotator.configure(test='Wilcoxon', text_format='full', loc='inside', verbose=0)
# annotator.apply_and_annotate()

vals_9 = l232_means["9"].values
vals_2 = l232_means["2"].values
n = len(vals_9)
for xpos, vals in zip([0, 1],[vals_9, vals_2]):
    axes[0].hlines(np.median(vals), xpos-0.2, xpos+0.2,color='white', lw=4, zorder=3)
jitter = 0.15
for k in range(n):
    x1 = 0 + np.random.uniform(-jitter, jitter)
    x2 = 1 + np.random.uniform(-jitter, jitter)
    y1, y2 = vals_9[k], vals_2[k]
    axes[0].plot([x1, x2], [y1, y2], color='black', linewidth=1, alpha=0.5, zorder=1)
    axes[0].scatter([x1], [y1], color=niche_color_dict['9'], s=30, alpha=0.8, edgecolor='black', zorder=2)
    axes[0].scatter([x2], [y2], color=niche_color_dict['2'], s=30, alpha=0.8, edgecolor='black', zorder=2)

axes[0].set_title("ExN-L2/3-2 (90wk)", fontsize=16)
axes[0].set_xlabel("Niche", fontsize=14)
axes[0].set_ylabel("Mean gene set score", fontsize=14)
axes[0].tick_params(axis='x', labelsize=14)
axes[0].tick_params(axis='y', labelsize=14)

axes[0].grid(False)
sns.despine(ax=axes[0], top=True, right=True)

sns.violinplot(data=l51_long, x="matched_cluster", y="Mean gene set score", order=["9", "3"],
               palette={"9": niche_color_dict["9"], "3": niche_color_dict["3"]},
               inner="box", cut=1, scale="width", width=0.7, linewidth=1, ax=axes[1], alpha=0.8)
# sns.boxplot(data=l51_long, x="matched_cluster", y="Mean gene set score", order=["9", "3"],
#             palette={"9": niche_color_dict["9"], "3": niche_color_dict["3"]},
#             width=0.7, showfliers=False, ax=axes[1], zorder=0, boxprops=dict(alpha=0.8))

pairs = [("9", "3")]
annotator = Annotator(axes[1], pairs, data=l51_long, x="matched_cluster", y="Mean gene set score", order=["9", "3"])
annotator.configure(test=None, text_format="full", loc="inside", verbose=0)
annotator.set_custom_annotations([f"Wilcoxon p = {p_l51:.3e}"])
annotator.annotate()
# annotator.configure(test='Wilcoxon', text_format='full', loc='inside', verbose=0)
# annotator.apply_and_annotate()

vals_9 = l51_means["9"].values
vals_3 = l51_means["3"].values
n = len(vals_9)
for xpos, vals in zip([0, 1],[vals_9, vals_3]):
    axes[1].hlines(np.median(vals), xpos-0.2, xpos+0.2,color='white', lw=4, zorder=3)
jitter = 0.15
for k in range(n):
    x1 = 0 + np.random.uniform(-jitter, jitter)
    x2 = 1 + np.random.uniform(-jitter, jitter)
    y1, y2 = vals_9[k], vals_3[k]
    axes[1].plot([x1, x2], [y1, y2], color='black', linewidth=1, alpha=0.5, zorder=1)
    axes[1].scatter([x1], [y1], color=niche_color_dict['9'], s=30, alpha=0.8, edgecolor='black', zorder=2)
    axes[1].scatter([x2], [y2], color=niche_color_dict['3'], s=30, alpha=0.8, edgecolor='black', zorder=2)

axes[1].set_title("ExN-L5-1 (90wk)", fontsize=16)
axes[1].set_xlabel("Niche", fontsize=14)
axes[1].set_ylabel("Mean gene set score", fontsize=14)
axes[1].tick_params(axis='x', labelsize=14)
axes[1].tick_params(axis='y', labelsize=14)

axes[1].grid(False)
sns.despine(ax=axes[1], top=True, right=True)

plt.tight_layout()
plt.show()
Within-cell type DE analysis for ExN-L2/3-2 (Niche 9 vs Niche 2)
[54]:
ctoi = 'ExN-L2/3-2'
noi_list = ['9', '2']
logfc_cutoff = 0.2
qval_cutoff = 0.05
pts_cutoff = 0.3

adata_sub_4wk_l232 = adata_sub_4wk[(adata_sub_4wk.obs['celltype_43'].isin([ctoi])) &
                                   (adata_sub_4wk.obs['matched_cluster'].isin(noi_list))].copy()
sc.tl.rank_genes_groups(adata_sub_4wk_l232, groupby='matched_cluster', method="wilcoxon", pts=True)
res_4wk_l232 = adata_sub_4wk_l232.uns["rank_genes_groups"]
adata_sub_24wk_l232 = adata_sub_24wk[(adata_sub_24wk.obs['celltype_43'].isin([ctoi])) &
                                     (adata_sub_24wk.obs['matched_cluster'].isin(noi_list))].copy()
sc.tl.rank_genes_groups(adata_sub_24wk_l232, groupby='matched_cluster', method="wilcoxon", pts=True)
res_24wk_l232 = adata_sub_24wk_l232.uns["rank_genes_groups"]
adata_sub_90wk_l232 = adata_sub_90wk[(adata_sub_90wk.obs['celltype_43'].isin([ctoi])) &
                                     (adata_sub_90wk.obs['matched_cluster'].isin(noi_list))].copy()
sc.tl.rank_genes_groups(adata_sub_90wk_l232, groupby='matched_cluster', method="wilcoxon", pts=True)
res_90wk_l232 = adata_sub_90wk_l232.uns["rank_genes_groups"]

### 4wk
genes = pd.Index(res_4wk_l232["names"][noi_list[0]], name="gene")
pts_series = res_4wk_l232["pts"][noi_list[0]]
pts_aligned = pts_series.reindex(genes)
df_4wk_l232 = pd.DataFrame({
    "gene": res_4wk_l232["names"][noi_list[0]],
    "logFC": res_4wk_l232["logfoldchanges"][noi_list[0]],
    "pval": res_4wk_l232["pvals"][noi_list[0]],
    "qval": res_4wk_l232["pvals_adj"][noi_list[0]],
    "pts": pts_aligned.values,
})

deg_4wk_l232 = df_4wk_l232[(df_4wk_l232["qval"] < qval_cutoff) & (df_4wk_l232["logFC"] > logfc_cutoff) & (df_4wk_l232["pts"] > pts_cutoff)].copy()
print(adata_sub_4wk_l232.obs['matched_cluster'].value_counts())
print(f"4wk: {deg_4wk_l232.shape[0]} upregulated genes in niche {noi_list[0]}")
print(deg_4wk_l232.head())

### 24wk
genes = pd.Index(res_24wk_l232["names"][noi_list[0]], name="gene")
pts_series = res_24wk_l232["pts"][noi_list[0]]
pts_aligned = pts_series.reindex(genes)
df_24wk_l232 = pd.DataFrame({
    "gene": res_24wk_l232["names"][noi_list[0]],
    "logFC": res_24wk_l232["logfoldchanges"][noi_list[0]],
    "pval": res_24wk_l232["pvals"][noi_list[0]],
    "qval": res_24wk_l232["pvals_adj"][noi_list[0]],
    "pts": pts_aligned.values,
})

deg_24wk_l232 = df_24wk_l232[(df_24wk_l232["qval"] < qval_cutoff) & (df_24wk_l232["logFC"] > logfc_cutoff) & (df_24wk_l232["pts"] > pts_cutoff)].copy()
print(adata_sub_24wk_l232.obs['matched_cluster'].value_counts())
print(f"24wk: {deg_24wk_l232.shape[0]} upregulated genes in niche {noi_list[0]}")
print(deg_24wk_l232.head())

### 90wk
genes = pd.Index(res_90wk_l232["names"][noi_list[0]], name="gene")
pts_series = res_90wk_l232["pts"][noi_list[0]]
pts_aligned = pts_series.reindex(genes)
df_90wk_l232 = pd.DataFrame({
    "gene": res_90wk_l232["names"][noi_list[0]],
    "logFC": res_90wk_l232["logfoldchanges"][noi_list[0]],
    "pval": res_90wk_l232["pvals"][noi_list[0]],
    "qval": res_90wk_l232["pvals_adj"][noi_list[0]],
    "pts": pts_aligned.values,
})

deg_90wk_l232 = df_90wk_l232[(df_90wk_l232["qval"] < qval_cutoff) & (df_90wk_l232["logFC"] > logfc_cutoff) & (df_90wk_l232["pts"] > pts_cutoff)].copy()
print(adata_sub_90wk_l232.obs['matched_cluster'].value_counts())
print(f"90wk: {deg_90wk_l232.shape[0]} upregulated genes in niche {noi_list[0]}")
print(deg_90wk_l232.head())


### plot
plt.figure(figsize=(4, 4))

set_4wk  = set(deg_4wk_l232["gene"])
set_24wk = set(deg_24wk_l232["gene"])
set_90wk = set(deg_90wk_l232["gene"])

v = venn3(
    [set_4wk, set_24wk, set_90wk],
    set_labels=("4wk", "24wk", "90wk"),
    set_colors=("#F8766D", "#7CAE00", "#00BFC4"),
    alpha=0.7,
)

for text in v.set_labels:
    if text:
        text.set_fontsize(14)
        text.set_color("black")

for text in v.subset_labels:
    if text:
        text.set_fontsize(14)
        text.set_color("black")

plt.title(f"Overlap of DEGs ({ctoi} in niche {noi_list[0]})", fontsize=16)
plt.tight_layout()
plt.show()
matched_cluster
9    1098
2     878
Name: count, dtype: int64
4wk: 9 upregulated genes in niche 9
      gene     logFC          pval          qval       pts
0     Rorb  0.774925  7.322197e-20  1.369251e-17  0.751366
1  Slc24a3  0.923426  1.828864e-17  2.279984e-15  0.584699
2   Kcnip3  0.714922  8.052570e-16  7.529153e-14  0.693989
3     Rora  0.824425  7.551450e-13  4.707071e-11  0.507286
4    Astn2  0.632285  1.280145e-08  6.839632e-07  0.508197
matched_cluster
9    916
2    751
Name: count, dtype: int64
24wk: 5 upregulated genes in niche 9
      gene     logFC          pval          qval       pts
0     Rorb  0.853215  1.048836e-16  1.961324e-14  0.669214
1    Sulf2  0.542315  4.503192e-09  4.210485e-07  0.689956
2   Kcnip3  0.473954  4.053267e-07  2.165603e-05  0.681223
3  Slc24a3  0.626887  7.833874e-06  3.255410e-04  0.453057
4     Rora  0.668312  1.845252e-05  6.901242e-04  0.409389
matched_cluster
9    2419
2    1560
Name: count, dtype: int64
90wk: 20 upregulated genes in niche 9
      gene     logFC          pval          qval       pts
0     Rorb  0.731387  1.458910e-36  1.818775e-34  0.768086
1    Sulf2  0.666925  5.255605e-33  3.931193e-31  0.780901
2   Kcnip3  0.589499  1.422790e-26  8.868724e-25  0.761885
3  Slc24a3  0.802887  1.720946e-21  9.194771e-20  0.510128
4  Slc17a7  0.264864  1.660130e-18  6.898764e-17  0.992972
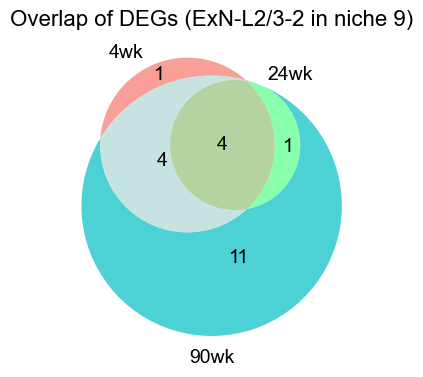
[55]:
set_4wk, set_24wk, set_90wk
[55]:
({'Astn2',
  'Cd24a',
  'Kcnip3',
  'Rora',
  'Rorb',
  'Rspo1',
  'Scube1',
  'Slc24a3',
  'Tnks'},
 {'Kcnip3', 'Rora', 'Rorb', 'Slc24a3', 'Sulf2'},
 {'Astn2',
  'Cd24a',
  'Cpne7',
  'Cpne9',
  'Deptor',
  'Drd1',
  'Irf3',
  'Kcnip3',
  'Pitpnm3',
  'Plp1',
  'Rora',
  'Rorb',
  'Rspo1',
  'Rsrp1',
  'Scube1',
  'Slc17a7',
  'Slc24a3',
  'Slc30a3',
  'Sulf2',
  'Tcap'})
[56]:
def volcano_plot_per_group(
    adata,
    key="rank_genes_groups",
    groups=None,
    qvals_thres=0.05,
    logfc_thres=0.2,
    max_labels=10,
    point_size=20,
    alpha=0.9,
    cmap_other="#BDBDBD",
    color_sig="#D62728",
    fontsize=12,
    title_fontsize=12,
    label_fontsize=12,
    tick_fontsize=12,
    save_dir=None
):
    try:
        from adjustText import adjust_text
        has_adjust = True
    except Exception:
        has_adjust = False

    if groups is None:
        groups = list(adata.obs[adata.uns[key]["params"]["groupby"]].astype(str).unique())

    n_groups = len(groups)
    fig, axes = plt.subplots(int(np.ceil(n_groups/4)), 4, figsize=(20, 4 * np.ceil(n_groups/4)))
    axes = np.atleast_1d(axes).ravel()
    for ax in axes.flatten()[n_groups:]:
        ax.axis('off')

    for i, g in enumerate(groups):

        df = sc.get.rank_genes_groups_df(adata, group=g, key=key).copy()
        df = df.dropna(subset=["names", "pvals_adj", "logfoldchanges"])
        df["qval"] = df["pvals_adj"].astype(float)

        eps = 1e-300
        df["-log10q"] = -np.log10(np.clip(df["qval"].to_numpy(), eps, None))
        df["logfc"] = df["logfoldchanges"].astype(float)

        sig_up = (df["qval"] < qvals_thres) & (df["logfc"] > logfc_thres)

        axes[i].scatter(df.loc[~sig_up, "logfc"], df.loc[~sig_up, "-log10q"], s=point_size,
                   alpha=alpha, c=cmap_other, linewidths=0, rasterized=True,)

        axes[i].scatter(df.loc[sig_up, "logfc"], df.loc[sig_up, "-log10q"], s=point_size,
                   alpha=0.9, c=color_sig, linewidths=0, rasterized=True,)

        axes[i].axvline(logfc_thres, ls="--", lw=1.0, c="#666666")
        axes[i].axhline(-np.log10(qvals_thres), ls="--", lw=1.0, c="#666666")

        df_sig = df.loc[sig_up].copy()
        if max_labels is not None and df_sig.shape[0] > max_labels:
            df_sig = df_sig.sort_values("qval", ascending=True).head(max_labels)

        texts = []
        for _, r in df_sig.iterrows():
            t = axes[i].text(r["logfc"], r["-log10q"], str(r["names"]), fontsize=fontsize, color=color_sig, ha="left", va="bottom")
            texts.append(t)

        if has_adjust and len(texts) > 0:
            adjust_text(
                texts,
                ax=axes[i],
                arrowprops=dict(arrowstyle="-", color="#888888", lw=1., alpha=0.8),
                expand_points=(1.2, 1.4),
                expand_text=(1.2, 1.4),
                force_text=(0.2, 0.4),
            )

        axes[i].set_title(f"Volcano plot: {g}", fontsize=title_fontsize, pad=10)
        axes[i].set_xlabel("log fold change", fontsize=label_fontsize)
        axes[i].set_ylabel("-log10(q value)", fontsize=label_fontsize)
        axes[i].tick_params(axis='x', labelsize=tick_fontsize)
        axes[i].tick_params(axis='y', labelsize=tick_fontsize)
        axes[i].spines["top"].set_visible(False)
        axes[i].spines["right"].set_visible(False)
        axes[i].grid(False)

    plt.tight_layout()
    if save_dir is not None:
        plt.savefig(save_dir, dpi=300)
    plt.show()
[57]:
volcano_plot_per_group(adata_sub_4wk_l232, key="rank_genes_groups", groups=noi_list[0],
                       qvals_thres=qval_cutoff, logfc_thres=logfc_cutoff, max_labels=5,
                       point_size=30, fontsize=14, title_fontsize=14, label_fontsize=14, tick_fontsize=14,)

volcano_plot_per_group(adata_sub_24wk_l232, key="rank_genes_groups", groups=noi_list[0],
                       qvals_thres=qval_cutoff, logfc_thres=logfc_cutoff, max_labels=5,
                       point_size=30, fontsize=14, title_fontsize=14, label_fontsize=14, tick_fontsize=14,)

volcano_plot_per_group(adata_sub_90wk_l232, key="rank_genes_groups", groups=noi_list[0],
                       qvals_thres=qval_cutoff, logfc_thres=logfc_cutoff, max_labels=5,
                       point_size=30, fontsize=14, title_fontsize=14, label_fontsize=14, tick_fontsize=14,)
Looks like you are using a tranform that doesn't support FancyArrowPatch, using ax.annotate instead. The arrows might strike through texts. Increasing shrinkA in arrowprops might help.
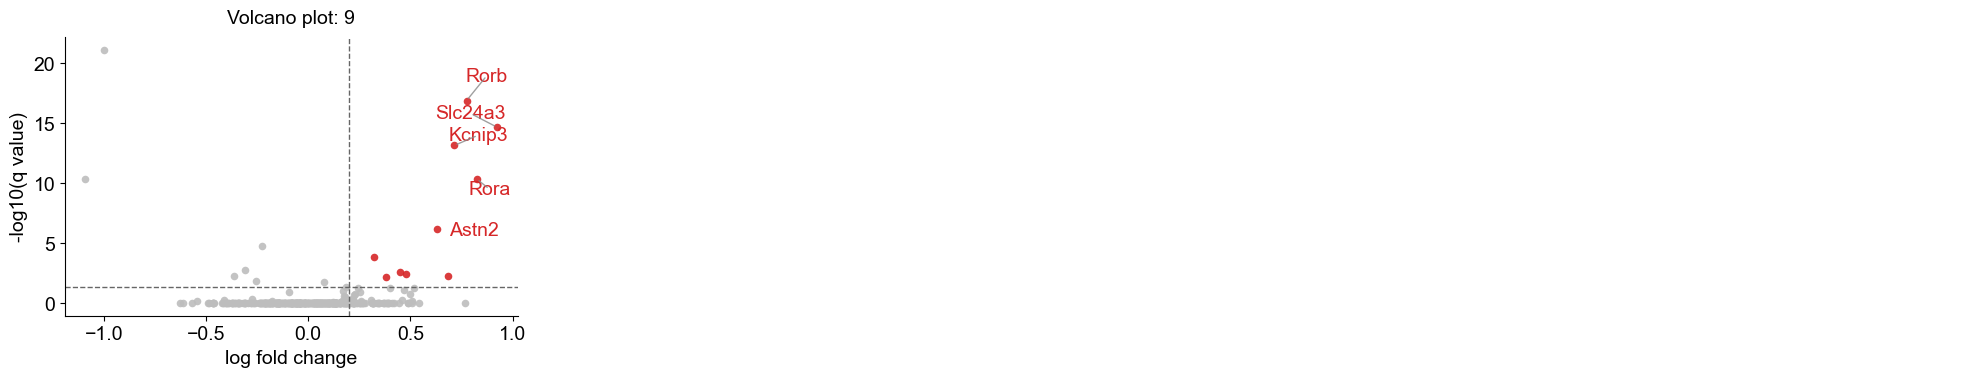
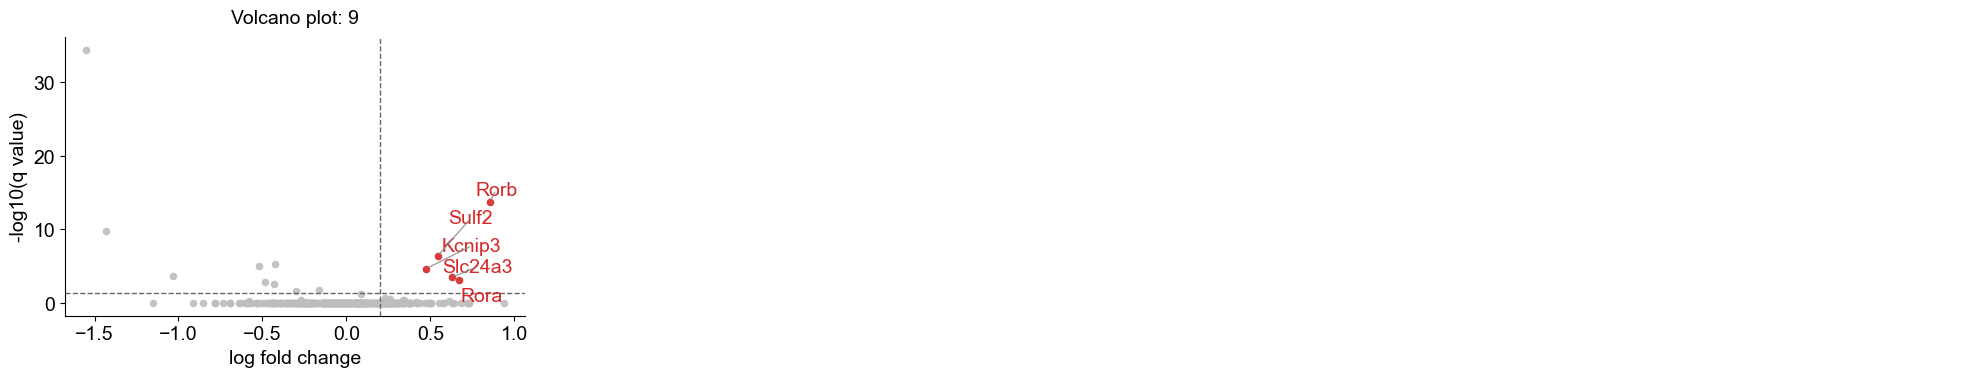
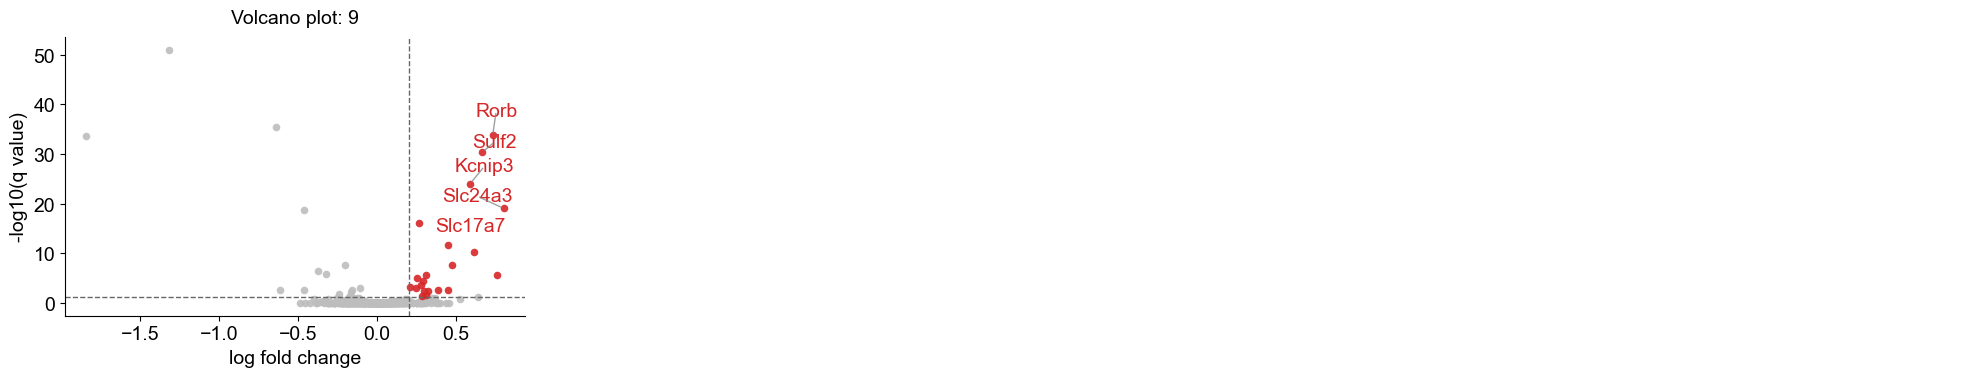
[58]:
n_col = 6

### 4wk
n_row = int(np.ceil(len(deg_4wk_l232["gene"]) / n_col))
fig, axes = plt.subplots(n_row, n_col, figsize=(n_col * 3, n_row * 4))
axes = axes.flatten()

j = 0
for i, gene in enumerate(deg_4wk_l232["gene"]):

    if gene in adata_sub_4wk_l232.var_names:
        expr = adata_sub_4wk_l232[:, gene].X.copy()
        if not isinstance(expr, np.ndarray):
            expr = expr.toarray().flatten()
        else:
            expr = expr.flatten()
    else:
        print(f"{gene} not found in var_names")
        continue

    df_l232 = adata_sub_4wk_l232.obs[["matched_cluster", 'slice_name']].copy()
    df_l232[gene] = expr

    l232_slice = df_l232.groupby(["slice_name", "matched_cluster"], observed=True)[gene].mean().unstack("matched_cluster")
    l232_slice = l232_slice.dropna(subset=noi_list)
    l232_long = l232_slice.reset_index().melt(id_vars="slice_name", value_vars=noi_list,
                                               var_name='matched_cluster', value_name="Mean expression")

    W_l232, p_l232 = wilcoxon(l232_slice[noi_list[0]], l232_slice[noi_list[1]], alternative="two-sided", zero_method="wilcox")
    if p_l232 >= 0.05:
        continue

    ### plot
    sns.violinplot(data=l232_long, x="matched_cluster", y="Mean expression", order=noi_list,
                   palette={noi_list[0]: niche_color_dict[noi_list[0]], noi_list[1]: niche_color_dict[noi_list[1]]},
                   inner="box", cut=1, scale="width", width=0.7, linewidth=1, ax=axes[j], alpha=0.8)
    # sns.boxplot(data=l232_long, x="matched_cluster", y="Mean expression", order=noi_list,
    #             palette={noi_list[0]: niche_color_dict[noi_list[0]], noi_list[1]: niche_color_dict[noi_list[1]]},
    #             width=0.7, showfliers=False, ax=axes[j], zorder=0, boxprops=dict(alpha=0.8))

    pairs = [(noi_list[0], noi_list[1])]
    annotator = Annotator(axes[j], pairs, data=l232_long, x="matched_cluster", y="Mean expression", order=noi_list)
    annotator.configure(test=None, text_format="full", loc="inside", verbose=0)
    annotator.set_custom_annotations([f"Wilcoxon p = {p_l232:.3e}"])
    annotator.annotate()
    # annotator.configure(test='Wilcoxon', text_format='full', loc='inside', verbose=0)
    # annotator.apply_and_annotate()

    vals_9 = l232_slice[noi_list[0]].values
    vals_2 = l232_slice[noi_list[1]].values
    n = len(vals_9)
    for xpos, vals in zip([0, 1],[vals_9, vals_2]):
        axes[j].hlines(np.median(vals), xpos-0.2, xpos+0.2,color='white', lw=4, zorder=3)
    jitter = 0.15
    for k in range(n):
        x1 = 0 + np.random.uniform(-jitter, jitter)
        x2 = 1 + np.random.uniform(-jitter, jitter)
        y1, y2 = vals_9[k], vals_2[k]
        axes[j].plot([x1, x2], [y1, y2], color='black', linewidth=1, alpha=0.5, zorder=1)
        axes[j].scatter([x1], [y1], color=niche_color_dict[noi_list[0]], s=30, alpha=0.8, edgecolor='black', zorder=2)
        axes[j].scatter([x2], [y2], color=niche_color_dict[noi_list[1]], s=30, alpha=0.8, edgecolor='black', zorder=2)

    axes[j].set_title(f"{gene} (ExN-L2/3-2 4wk)", fontsize=16)
    axes[j].set_xlabel("Niche", fontsize=14)
    axes[j].set_ylabel("Expression", fontsize=14)
    axes[j].tick_params(axis='x', labelsize=14)
    axes[j].tick_params(axis='y', labelsize=14)

    axes[j].grid(False)
    sns.despine(ax=axes[j], top=True, right=True)
    j += 1

for k in range(j, n_row * n_col):
    axes[k].axis('off')

plt.tight_layout()
plt.show()


### 24wk
n_row = int(np.ceil(len(deg_24wk_l232["gene"]) / n_col))
fig, axes = plt.subplots(n_row, n_col, figsize=(n_col * 3, n_row * 4))
axes = axes.flatten()

j = 0
for i, gene in enumerate(deg_24wk_l232["gene"]):

    if gene in adata_sub_24wk_l232.var_names:
        expr = adata_sub_24wk_l232[:, gene].X.copy()
        if not isinstance(expr, np.ndarray):
            expr = expr.toarray().flatten()
        else:
            expr = expr.flatten()
    else:
        print(f"{gene} not found in var_names")
        continue

    df_l232 = adata_sub_24wk_l232.obs[["matched_cluster", 'slice_name']].copy()
    df_l232[gene] = expr

    l232_slice = df_l232.groupby(["slice_name", "matched_cluster"], observed=True)[gene].mean().unstack("matched_cluster")
    l232_slice = l232_slice.dropna(subset=noi_list)
    l232_long = l232_slice.reset_index().melt(id_vars="slice_name", value_vars=noi_list,
                                               var_name='matched_cluster', value_name="Mean expression")

    W_l232, p_l232 = wilcoxon(l232_slice[noi_list[0]], l232_slice[noi_list[1]], alternative="two-sided", zero_method="wilcox")
    if p_l232 >= 0.05:
        continue

    ### plot
    sns.violinplot(data=l232_long, x="matched_cluster", y="Mean expression", order=noi_list,
                   palette={noi_list[0]: niche_color_dict[noi_list[0]], noi_list[1]: niche_color_dict[noi_list[1]]},
                   inner="box", cut=1, scale="width", width=0.7, linewidth=1, ax=axes[j], alpha=0.8)
    # sns.boxplot(data=l232_long, x="matched_cluster", y="Mean expression", order=noi_list,
    #             palette={noi_list[0]: niche_color_dict[noi_list[0]], noi_list[1]: niche_color_dict[noi_list[1]]},
    #             width=0.7, showfliers=False, ax=axes[j], zorder=0, boxprops=dict(alpha=0.8))

    pairs = [(noi_list[0], noi_list[1])]
    annotator = Annotator(axes[j], pairs, data=l232_long, x="matched_cluster", y="Mean expression", order=noi_list)
    annotator.configure(test=None, text_format="full", loc="inside", verbose=0)
    annotator.set_custom_annotations([f"Wilcoxon p = {p_l232:.3e}"])
    annotator.annotate()
    # annotator.configure(test='Wilcoxon', text_format='full', loc='inside', verbose=0)
    # annotator.apply_and_annotate()

    vals_9 = l232_slice[noi_list[0]].values
    vals_2 = l232_slice[noi_list[1]].values
    n = len(vals_9)
    for xpos, vals in zip([0, 1],[vals_9, vals_2]):
        axes[j].hlines(np.median(vals), xpos-0.2, xpos+0.2,color='white', lw=4, zorder=3)
    jitter = 0.15
    for k in range(n):
        x1 = 0 + np.random.uniform(-jitter, jitter)
        x2 = 1 + np.random.uniform(-jitter, jitter)
        y1, y2 = vals_9[k], vals_2[k]
        axes[j].plot([x1, x2], [y1, y2], color='black', linewidth=1, alpha=0.5, zorder=1)
        axes[j].scatter([x1], [y1], color=niche_color_dict[noi_list[0]], s=30, alpha=0.8, edgecolor='black', zorder=2)
        axes[j].scatter([x2], [y2], color=niche_color_dict[noi_list[1]], s=30, alpha=0.8, edgecolor='black', zorder=2)

    axes[j].set_title(f"{gene} (ExN-L2/3-2 24wk)", fontsize=16)
    axes[j].set_xlabel("Niche", fontsize=14)
    axes[j].set_ylabel("Expression", fontsize=14)
    axes[j].tick_params(axis='x', labelsize=14)
    axes[j].tick_params(axis='y', labelsize=14)

    axes[j].grid(False)
    sns.despine(ax=axes[j], top=True, right=True)
    j += 1

for k in range(j, n_row * n_col):
    axes[k].axis('off')

plt.tight_layout()
plt.show()


### 90wk
n_row = int(np.ceil(len(deg_90wk_l232["gene"]) / n_col))
fig, axes = plt.subplots(n_row, n_col, figsize=(n_col * 3, n_row * 4))
axes = axes.flatten()

j = 0
for i, gene in enumerate(deg_90wk_l232["gene"]):

    if gene in adata_sub_90wk_l232.var_names:
        expr = adata_sub_90wk_l232[:, gene].X.copy()
        if not isinstance(expr, np.ndarray):
            expr = expr.toarray().flatten()
        else:
            expr = expr.flatten()
    else:
        print(f"{gene} not found in var_names")
        continue

    df_l232 = adata_sub_90wk_l232.obs[["matched_cluster", 'slice_name']].copy()
    df_l232[gene] = expr

    l232_slice = df_l232.groupby(["slice_name", "matched_cluster"], observed=True)[gene].mean().unstack("matched_cluster")
    l232_slice = l232_slice.dropna(subset=noi_list)
    l232_long = l232_slice.reset_index().melt(id_vars="slice_name", value_vars=noi_list,
                                               var_name='matched_cluster', value_name="Mean expression")

    W_l232, p_l232 = wilcoxon(l232_slice[noi_list[0]], l232_slice[noi_list[1]], alternative="two-sided", zero_method="wilcox")
    if p_l232 >= 0.05:
        continue

    ### plot
    sns.violinplot(data=l232_long, x="matched_cluster", y="Mean expression", order=noi_list,
                   palette={noi_list[0]: niche_color_dict[noi_list[0]], noi_list[1]: niche_color_dict[noi_list[1]]},
                   inner="box", cut=1, scale="width", width=0.7, linewidth=1, ax=axes[j], alpha=0.8)
    # sns.boxplot(data=l232_long, x="matched_cluster", y="Mean expression", order=noi_list,
    #             palette={noi_list[0]: niche_color_dict[noi_list[0]], noi_list[1]: niche_color_dict[noi_list[1]]},
    #             width=0.7, showfliers=False, ax=axes[j], zorder=0, boxprops=dict(alpha=0.8))

    pairs = [(noi_list[0], noi_list[1])]
    annotator = Annotator(axes[j], pairs, data=l232_long, x="matched_cluster", y="Mean expression", order=noi_list)
    annotator.configure(test=None, text_format="full", loc="inside", verbose=0)
    annotator.set_custom_annotations([f"Wilcoxon p = {p_l232:.3e}"])
    annotator.annotate()
    # annotator.configure(test='Wilcoxon', text_format='full', loc='inside', verbose=0)
    # annotator.apply_and_annotate()

    vals_9 = l232_slice[noi_list[0]].values
    vals_2 = l232_slice[noi_list[1]].values
    n = len(vals_9)
    for xpos, vals in zip([0, 1],[vals_9, vals_2]):
        axes[j].hlines(np.median(vals), xpos-0.2, xpos+0.2,color='white', lw=4, zorder=3)
    jitter = 0.15
    for k in range(n):
        x1 = 0 + np.random.uniform(-jitter, jitter)
        x2 = 1 + np.random.uniform(-jitter, jitter)
        y1, y2 = vals_9[k], vals_2[k]
        axes[j].plot([x1, x2], [y1, y2], color='black', linewidth=1, alpha=0.5, zorder=1)
        axes[j].scatter([x1], [y1], color=niche_color_dict[noi_list[0]], s=30, alpha=0.8, edgecolor='black', zorder=2)
        axes[j].scatter([x2], [y2], color=niche_color_dict[noi_list[1]], s=30, alpha=0.8, edgecolor='black', zorder=2)

    axes[j].set_title(f"{gene} (ExN-L2/3-2 90wk)", fontsize=16)
    axes[j].set_xlabel("Niche", fontsize=14)
    axes[j].set_ylabel("Expression", fontsize=14)
    axes[j].tick_params(axis='x', labelsize=14)
    axes[j].tick_params(axis='y', labelsize=14)

    axes[j].grid(False)
    sns.despine(ax=axes[j], top=True, right=True)
    j += 1

for k in range(j, n_row * n_col):
    axes[k].axis('off')

plt.tight_layout()
plt.show()
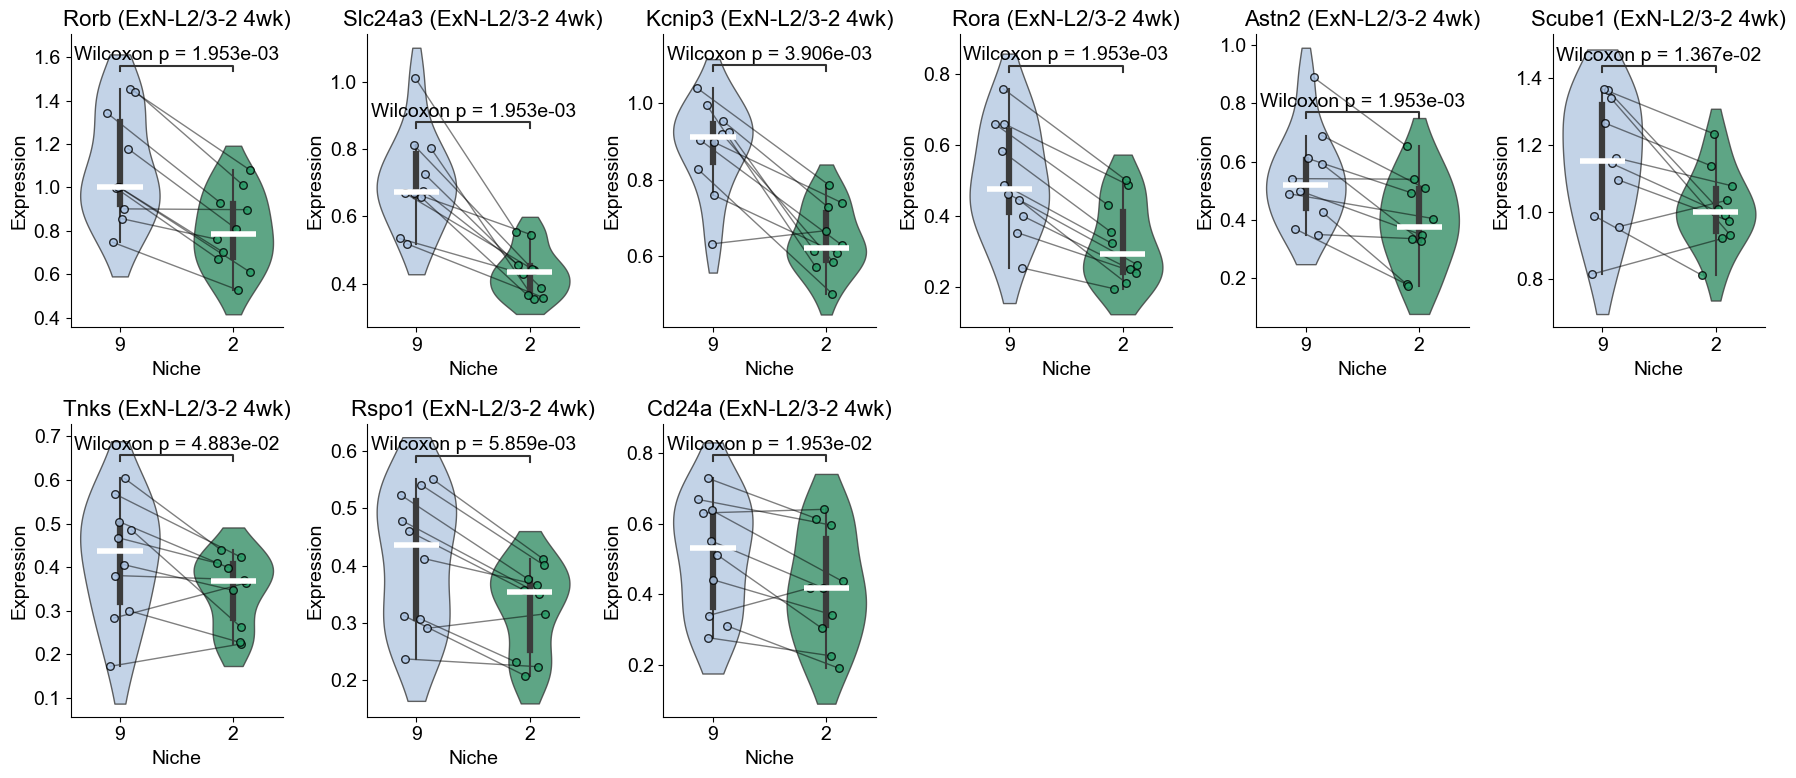
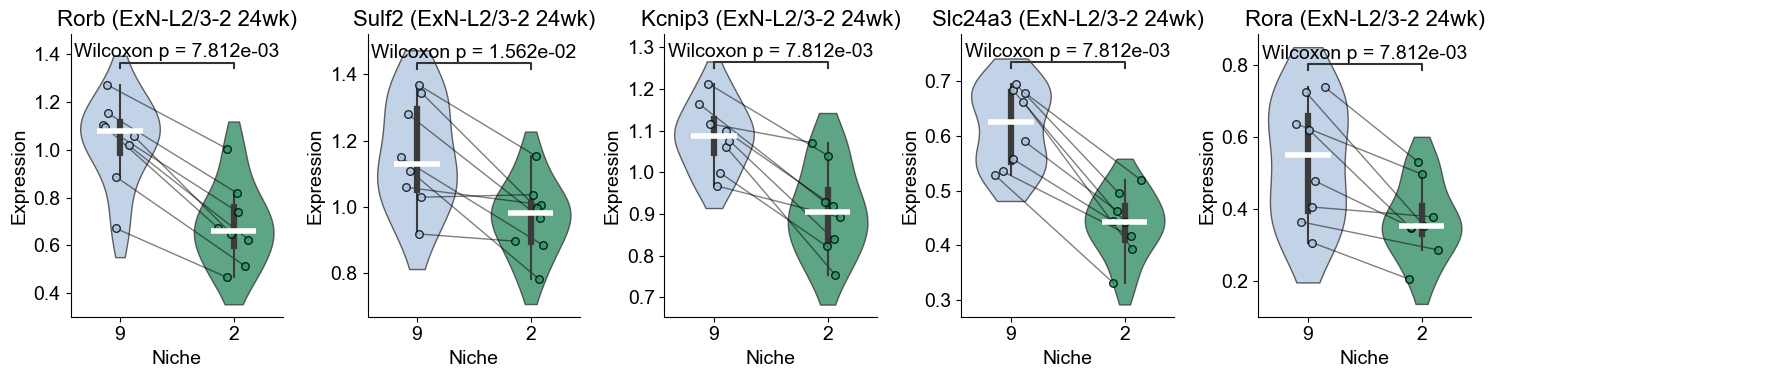
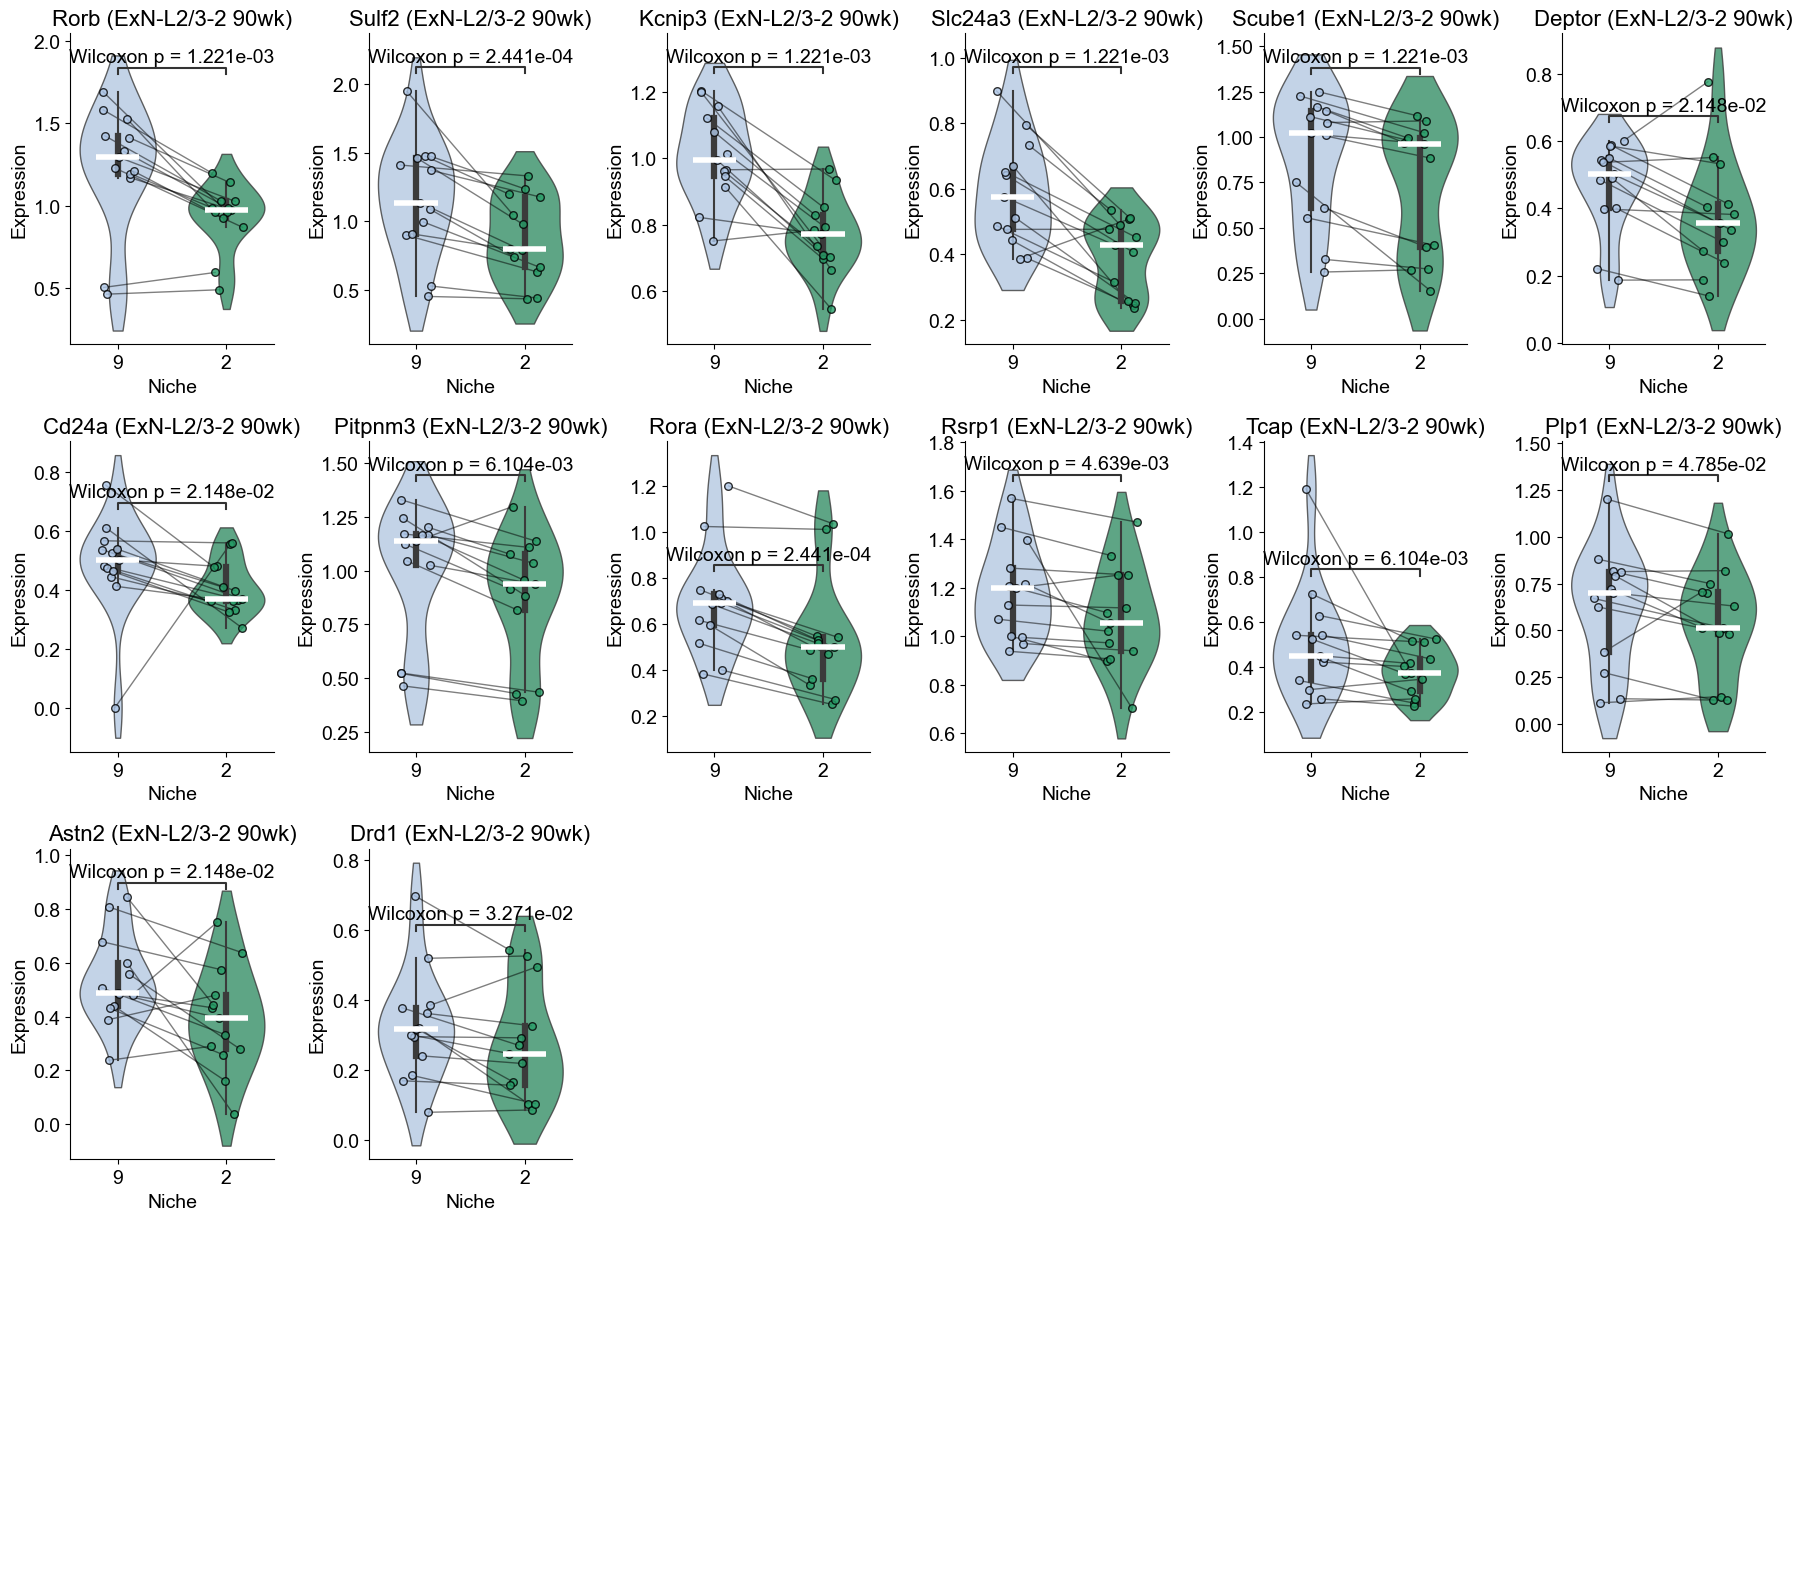
Within-cell type DE analysis for ExN-L5-1 (Niche 9 vs Niche 3)
[59]:
ctoi = 'ExN-L5-1'
noi_list = ['9', '3']
logfc_cutoff = 0.2
qval_cutoff = 0.05
pts_cutoff = 0.3

adata_sub_4wk_l51 = adata_sub_4wk[(adata_sub_4wk.obs['celltype_43'].isin([ctoi])) &
                                   (adata_sub_4wk.obs['matched_cluster'].isin(noi_list))].copy()
sc.tl.rank_genes_groups(adata_sub_4wk_l51, groupby='matched_cluster', method="wilcoxon", pts=True)
res_4wk_l51 = adata_sub_4wk_l51.uns["rank_genes_groups"]
adata_sub_24wk_l51 = adata_sub_24wk[(adata_sub_24wk.obs['celltype_43'].isin([ctoi])) &
                                     (adata_sub_24wk.obs['matched_cluster'].isin(noi_list))].copy()
sc.tl.rank_genes_groups(adata_sub_24wk_l51, groupby='matched_cluster', method="wilcoxon", pts=True)
res_24wk_l51 = adata_sub_24wk_l51.uns["rank_genes_groups"]
adata_sub_90wk_l51 = adata_sub_90wk[(adata_sub_90wk.obs['celltype_43'].isin([ctoi])) &
                                     (adata_sub_90wk.obs['matched_cluster'].isin(noi_list))].copy()
sc.tl.rank_genes_groups(adata_sub_90wk_l51, groupby='matched_cluster', method="wilcoxon", pts=True)
res_90wk_l51 = adata_sub_90wk_l51.uns["rank_genes_groups"]

### 4wk
genes = pd.Index(res_4wk_l51["names"][noi_list[0]], name="gene")
pts_series = res_4wk_l51["pts"][noi_list[0]]
pts_aligned = pts_series.reindex(genes)
df_4wk_l51 = pd.DataFrame({
    "gene": res_4wk_l51["names"][noi_list[0]],
    "logFC": res_4wk_l51["logfoldchanges"][noi_list[0]],
    "pval": res_4wk_l51["pvals"][noi_list[0]],
    "qval": res_4wk_l51["pvals_adj"][noi_list[0]],
    "pts": pts_aligned.values,
})

deg_4wk_l51 = df_4wk_l51[(df_4wk_l51["qval"] < qval_cutoff) & (df_4wk_l51["logFC"] > logfc_cutoff) & (df_4wk_l51["pts"] > pts_cutoff)].copy()
print(adata_sub_4wk_l51.obs['matched_cluster'].value_counts())
print(f"4wk: {deg_4wk_l51.shape[0]} upregulated genes in niche {noi_list[0]}")
print(deg_4wk_l51.head())

### 24wk
genes = pd.Index(res_24wk_l51["names"][noi_list[0]], name="gene")
pts_series = res_24wk_l51["pts"][noi_list[0]]
pts_aligned = pts_series.reindex(genes)
df_24wk_l51 = pd.DataFrame({
    "gene": res_24wk_l51["names"][noi_list[0]],
    "logFC": res_24wk_l51["logfoldchanges"][noi_list[0]],
    "pval": res_24wk_l51["pvals"][noi_list[0]],
    "qval": res_24wk_l51["pvals_adj"][noi_list[0]],
    "pts": pts_aligned.values,
})

deg_24wk_l51 = df_24wk_l51[(df_24wk_l51["qval"] < qval_cutoff) & (df_24wk_l51["logFC"] > logfc_cutoff) & (df_24wk_l51["pts"] > pts_cutoff)].copy()
print(adata_sub_24wk_l51.obs['matched_cluster'].value_counts())
print(f"24wk: {deg_24wk_l51.shape[0]} upregulated genes in niche {noi_list[0]}")
print(deg_24wk_l51.head())

### 90wk
genes = pd.Index(res_90wk_l51["names"][noi_list[0]], name="gene")
pts_series = res_90wk_l51["pts"][noi_list[0]]
pts_aligned = pts_series.reindex(genes)
df_90wk_l51 = pd.DataFrame({
    "gene": res_90wk_l51["names"][noi_list[0]],
    "logFC": res_90wk_l51["logfoldchanges"][noi_list[0]],
    "pval": res_90wk_l51["pvals"][noi_list[0]],
    "qval": res_90wk_l51["pvals_adj"][noi_list[0]],
    "pts": pts_aligned.values,
})

deg_90wk_l51 = df_90wk_l51[(df_90wk_l51["qval"] < qval_cutoff) & (df_90wk_l51["logFC"] > logfc_cutoff) & (df_90wk_l51["pts"] > pts_cutoff)].copy()
print(adata_sub_90wk_l51.obs['matched_cluster'].value_counts())
print(f"90wk: {deg_90wk_l51.shape[0]} upregulated genes in niche {noi_list[0]}")
print(deg_90wk_l51.head())

### plot
plt.figure(figsize=(4, 4))

set_4wk  = set(deg_4wk_l51["gene"])
set_24wk = set(deg_24wk_l51["gene"])
set_90wk = set(deg_90wk_l51["gene"])

v = venn3(
    [set_4wk, set_24wk, set_90wk],
    set_labels=("4wk", "24wk", "90wk"),
    set_colors=("#F8766D", "#7CAE00", "#00BFC4"),
    alpha=0.7,
)

for text in v.set_labels:
    if text:
        text.set_fontsize(14)
        text.set_color("black")

for text in v.subset_labels:
    if text:
        text.set_fontsize(14)
        text.set_color("black")

plt.title(f"Overlap of DEGs ({ctoi} in niche {noi_list[0]})", fontsize=16)
plt.tight_layout()
plt.show()
matched_cluster
9    1886
3    1003
Name: count, dtype: int64
4wk: 15 upregulated genes in niche 9
      gene     logFC          pval          qval       pts
0     Rorb  0.874306  3.648589e-16  6.822862e-14  0.502121
1  Slc24a3  0.567337  9.624403e-15  1.199842e-12  0.702545
2    Lamp5  0.880714  7.537692e-14  7.047742e-12  0.443266
3    Sulf2  0.355796  4.709745e-13  3.522889e-11  0.924708
4  Slc30a3  0.470212  2.392543e-10  1.278302e-08  0.683457
matched_cluster
9    1289
3     645
Name: count, dtype: int64
24wk: 10 upregulated genes in niche 9
       gene     logFC          pval          qval       pts
0      Rorb  1.164230  3.746683e-15  1.401259e-12  0.464701
1   Slc24a3  0.606686  5.464388e-10  1.021841e-07  0.657874
2   Slc30a3  0.540377  1.806195e-08  2.251723e-06  0.696664
3     Lamp5  0.584591  3.812952e-06  1.782555e-04  0.498836
4  Cntnap5a  0.626656  1.071727e-05  3.643872e-04  0.431342
matched_cluster
9    2039
3     728
Name: count, dtype: int64
90wk: 19 upregulated genes in niche 9
      gene     logFC          pval          qval       pts
0   Scube1  0.510018  8.576229e-15  1.069170e-12  0.802845
1    Cd24a  0.977716  2.261900e-14  2.114877e-12  0.458558
2    Lamp5  0.828462  4.454065e-14  2.776367e-12  0.561059
3  Slc30a3  0.590687  1.253502e-13  6.697281e-12  0.749877
4    Sulf2  0.351153  6.155484e-13  2.877689e-11  0.895537
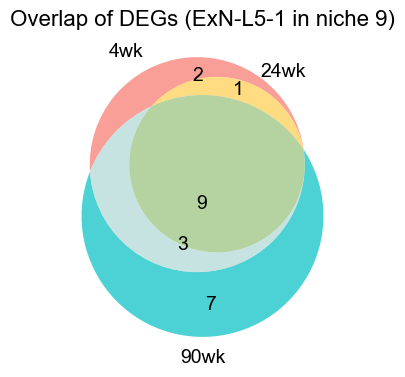
[60]:
set_4wk, set_24wk, set_90wk
[60]:
({'Ano3',
  'Cntnap5a',
  'Fezf2',
  'Ildr2',
  'Kcnip3',
  'Lamp5',
  'Mef2c',
  'Nmnat2',
  'Rora',
  'Rorb',
  'Rreb1',
  'Scube1',
  'Slc24a3',
  'Slc30a3',
  'Sulf2'},
 {'Cntnap5a',
  'Ildr2',
  'Kcnip3',
  'Lamp5',
  'Mef2c',
  'Rora',
  'Rorb',
  'Rreb1',
  'Slc24a3',
  'Slc30a3'},
 {'Cd24a',
  'Cntnap5a',
  'Cpne9',
  'Deptor',
  'Fezf2',
  'Fth1',
  'Hivep3',
  'Ildr2',
  'Kcnip3',
  'Lamp5',
  'Nfkb1',
  'Rora',
  'Rorb',
  'Rreb1',
  'Scube1',
  'Serinc3',
  'Slc24a3',
  'Slc30a3',
  'Sulf2'})
[61]:
volcano_plot_per_group(adata_sub_4wk_l51, key="rank_genes_groups", groups=noi_list[0],
                       qvals_thres=qval_cutoff, logfc_thres=logfc_cutoff, max_labels=10,
                       point_size=30, fontsize=14, title_fontsize=14, label_fontsize=14, tick_fontsize=14,)

volcano_plot_per_group(adata_sub_24wk_l51, key="rank_genes_groups", groups=noi_list[0],
                       qvals_thres=qval_cutoff, logfc_thres=logfc_cutoff, max_labels=10,
                       point_size=30, fontsize=14, title_fontsize=14, label_fontsize=14, tick_fontsize=14,)

volcano_plot_per_group(adata_sub_90wk_l51, key="rank_genes_groups", groups=noi_list[0],
                       qvals_thres=qval_cutoff, logfc_thres=logfc_cutoff, max_labels=10,
                       point_size=30, fontsize=14, title_fontsize=14, label_fontsize=14, tick_fontsize=14,)
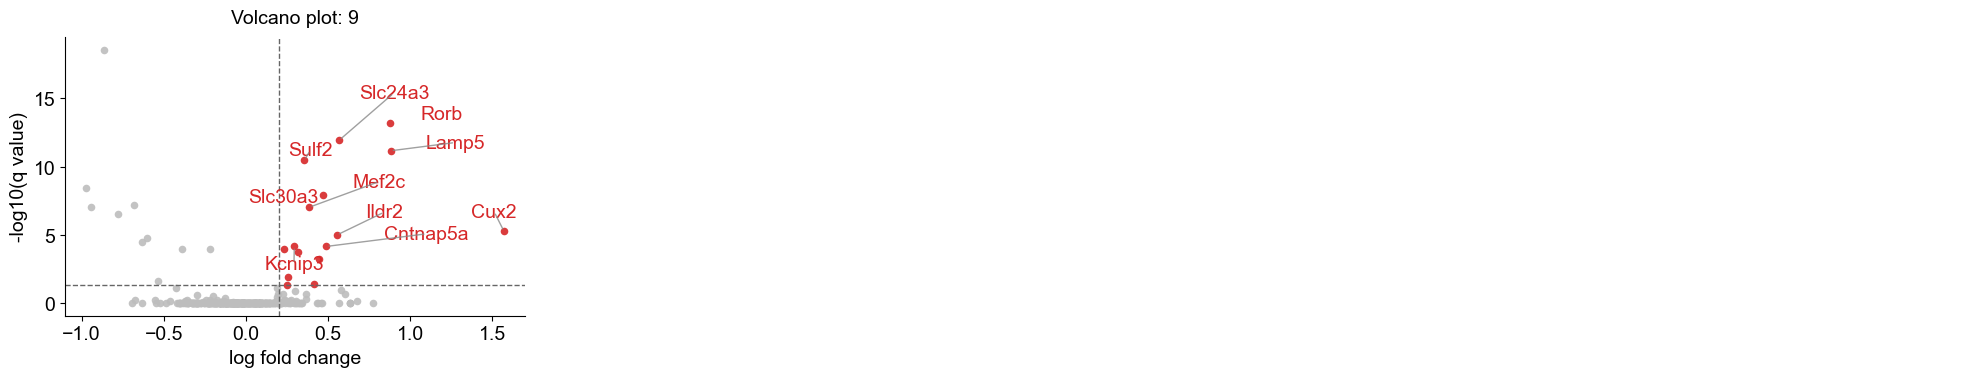
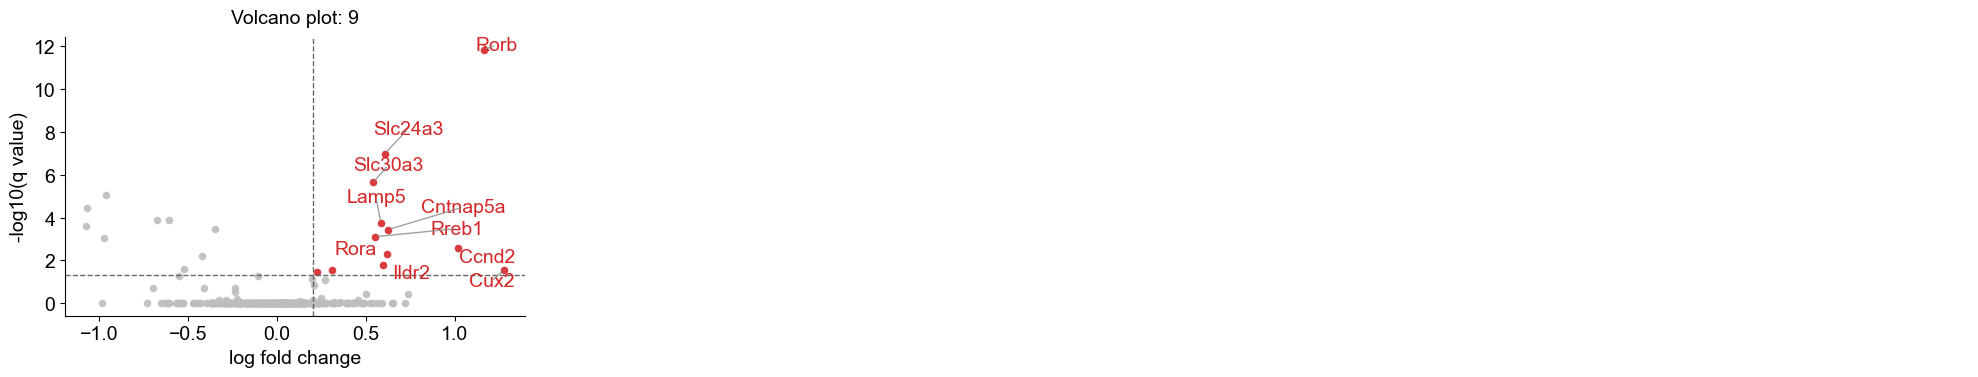
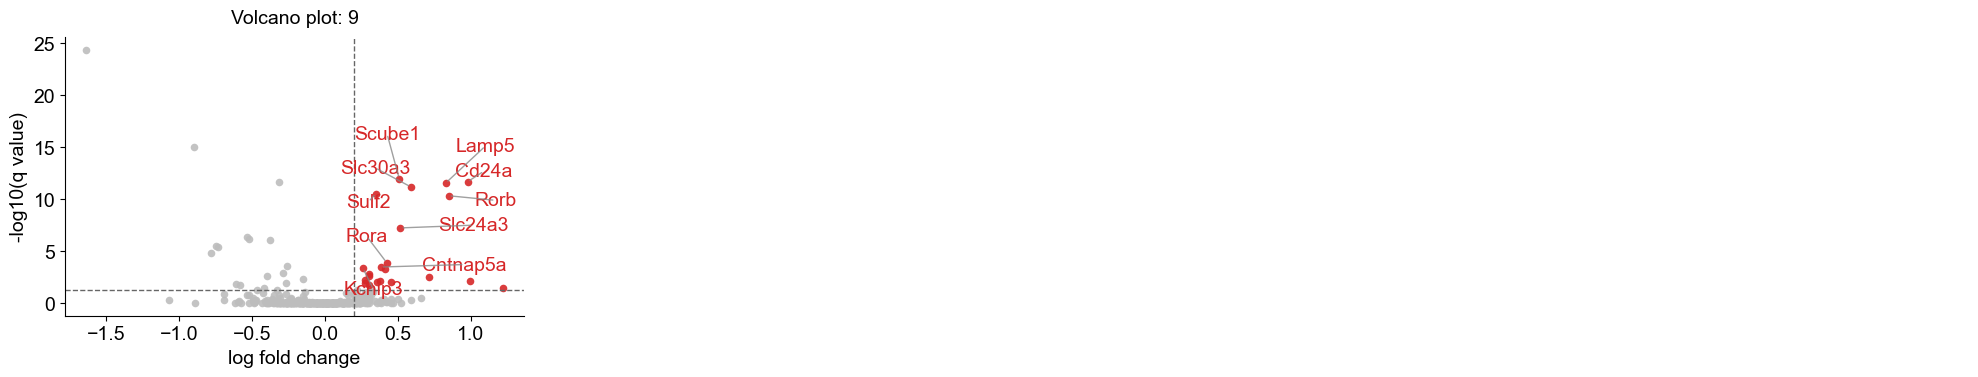
[62]:
n_col = 6

### 4wk
n_row = int(np.ceil(len(deg_4wk_l51["gene"]) / n_col))
fig, axes = plt.subplots(n_row, n_col, figsize=(n_col * 3, n_row * 4))
axes = axes.flatten()

j = 0
for i, gene in enumerate(deg_4wk_l51["gene"]):

    if gene in adata_sub_4wk_l51.var_names:
        expr = adata_sub_4wk_l51[:, gene].X.copy()
        if not isinstance(expr, np.ndarray):
            expr = expr.toarray().flatten()
        else:
            expr = expr.flatten()
    else:
        print(f"{gene} not found in var_names")
        continue

    df_l51 = adata_sub_4wk_l51.obs[["matched_cluster", 'slice_name']].copy()
    df_l51[gene] = expr

    l51_slice = df_l51.groupby(["slice_name", "matched_cluster"], observed=True)[gene].mean().unstack("matched_cluster")
    l51_slice = l51_slice.dropna(subset=noi_list)
    l51_long = l51_slice.reset_index().melt(id_vars="slice_name", value_vars=noi_list,
                                               var_name='matched_cluster', value_name="Mean expression")

    W_l51, p_l51 = wilcoxon(l51_slice[noi_list[0]], l51_slice[noi_list[1]], alternative="two-sided", zero_method="wilcox")
    if p_l51 >= 0.05:
        continue

    ### plot
    sns.violinplot(data=l51_long, x="matched_cluster", y="Mean expression", order=noi_list,
                   palette={noi_list[0]: niche_color_dict[noi_list[0]], noi_list[1]: niche_color_dict[noi_list[1]]},
                   inner="box", cut=1, scale="width", width=0.7, linewidth=1, ax=axes[j], alpha=0.8)
    # sns.boxplot(data=l51_long, x="matched_cluster", y="Mean expression", order=noi_list,
    #             palette={noi_list[0]: niche_color_dict[noi_list[0]], noi_list[1]: niche_color_dict[noi_list[1]]},
    #             width=0.7, showfliers=False, ax=axes[j], zorder=0, boxprops=dict(alpha=0.8))

    pairs = [(noi_list[0], noi_list[1])]
    annotator = Annotator(axes[j], pairs, data=l51_long, x="matched_cluster", y="Mean expression", order=noi_list)
    annotator.configure(test=None, text_format="full", loc="inside", verbose=0)
    annotator.set_custom_annotations([f"Wilcoxon p = {p_l51:.3e}"])
    annotator.annotate()
    # annotator.configure(test='Wilcoxon', text_format='full', loc='inside', verbose=0)
    # annotator.apply_and_annotate()

    vals_9 = l51_slice[noi_list[0]].values
    vals_2 = l51_slice[noi_list[1]].values
    n = len(vals_9)
    for xpos, vals in zip([0, 1],[vals_9, vals_2]):
        axes[j].hlines(np.median(vals), xpos-0.2, xpos+0.2,color='white', lw=4, zorder=3)
    jitter = 0.15
    for k in range(n):
        x1 = 0 + np.random.uniform(-jitter, jitter)
        x2 = 1 + np.random.uniform(-jitter, jitter)
        y1, y2 = vals_9[k], vals_2[k]
        axes[j].plot([x1, x2], [y1, y2], color='black', linewidth=1, alpha=0.5, zorder=1)
        axes[j].scatter([x1], [y1], color=niche_color_dict[noi_list[0]], s=30, alpha=0.8, edgecolor='black', zorder=2)
        axes[j].scatter([x2], [y2], color=niche_color_dict[noi_list[1]], s=30, alpha=0.8, edgecolor='black', zorder=2)

    axes[j].set_title(f"{gene} (ExN-L5-1 4wk)", fontsize=16)
    axes[j].set_xlabel("Niche", fontsize=14)
    axes[j].set_ylabel("Expression", fontsize=14)
    axes[j].tick_params(axis='x', labelsize=14)
    axes[j].tick_params(axis='y', labelsize=14)

    axes[j].grid(False)
    sns.despine(ax=axes[j], top=True, right=True)
    j += 1

for k in range(j, n_row * n_col):
    axes[k].axis('off')

plt.tight_layout()
plt.show()


### 24wk
n_row = int(np.ceil(len(deg_24wk_l51["gene"]) / n_col))
fig, axes = plt.subplots(n_row, n_col, figsize=(n_col * 3, n_row * 4))
axes = axes.flatten()

j = 0
for i, gene in enumerate(deg_24wk_l51["gene"]):

    if gene in adata_sub_24wk_l51.var_names:
        expr = adata_sub_24wk_l51[:, gene].X.copy()
        if not isinstance(expr, np.ndarray):
            expr = expr.toarray().flatten()
        else:
            expr = expr.flatten()
    else:
        print(f"{gene} not found in var_names")
        continue

    df_l51 = adata_sub_24wk_l51.obs[["matched_cluster", 'slice_name']].copy()
    df_l51[gene] = expr

    l51_slice = df_l51.groupby(["slice_name", "matched_cluster"], observed=True)[gene].mean().unstack("matched_cluster")
    l51_slice = l51_slice.dropna(subset=noi_list)
    l51_long = l51_slice.reset_index().melt(id_vars="slice_name", value_vars=noi_list,
                                               var_name='matched_cluster', value_name="Mean expression")

    W_l51, p_l51 = wilcoxon(l51_slice[noi_list[0]], l51_slice[noi_list[1]], alternative="two-sided", zero_method="wilcox")
    if p_l51 >= 0.05:
        continue

    ### plot
    sns.violinplot(data=l51_long, x="matched_cluster", y="Mean expression", order=noi_list,
                   palette={noi_list[0]: niche_color_dict[noi_list[0]], noi_list[1]: niche_color_dict[noi_list[1]]},
                   inner="box", cut=1, scale="width", width=0.7, linewidth=1, ax=axes[j], alpha=0.8)
    # sns.boxplot(data=l51_long, x="matched_cluster", y="Mean expression", order=noi_list,
    #             palette={noi_list[0]: niche_color_dict[noi_list[0]], noi_list[1]: niche_color_dict[noi_list[1]]},
    #             width=0.7, showfliers=False, ax=axes[j], zorder=0, boxprops=dict(alpha=0.8))

    pairs = [(noi_list[0], noi_list[1])]
    annotator = Annotator(axes[j], pairs, data=l51_long, x="matched_cluster", y="Mean expression", order=noi_list)
    annotator.configure(test=None, text_format="full", loc="inside", verbose=0)
    annotator.set_custom_annotations([f"Wilcoxon p = {p_l51:.3e}"])
    annotator.annotate()
    # annotator.configure(test='Wilcoxon', text_format='full', loc='inside', verbose=0)
    # annotator.apply_and_annotate()

    vals_9 = l51_slice[noi_list[0]].values
    vals_2 = l51_slice[noi_list[1]].values
    n = len(vals_9)
    for xpos, vals in zip([0, 1],[vals_9, vals_2]):
        axes[j].hlines(np.median(vals), xpos-0.2, xpos+0.2,color='white', lw=4, zorder=3)
    jitter = 0.15
    for k in range(n):
        x1 = 0 + np.random.uniform(-jitter, jitter)
        x2 = 1 + np.random.uniform(-jitter, jitter)
        y1, y2 = vals_9[k], vals_2[k]
        axes[j].plot([x1, x2], [y1, y2], color='black', linewidth=1, alpha=0.5, zorder=1)
        axes[j].scatter([x1], [y1], color=niche_color_dict[noi_list[0]], s=30, alpha=0.8, edgecolor='black', zorder=2)
        axes[j].scatter([x2], [y2], color=niche_color_dict[noi_list[1]], s=30, alpha=0.8, edgecolor='black', zorder=2)

    axes[j].set_title(f"{gene} (ExN-L5-1 24wk)", fontsize=16)
    axes[j].set_xlabel("Niche", fontsize=14)
    axes[j].set_ylabel("Expression", fontsize=14)
    axes[j].tick_params(axis='x', labelsize=14)
    axes[j].tick_params(axis='y', labelsize=14)

    axes[j].grid(False)
    sns.despine(ax=axes[j], top=True, right=True)
    j += 1

for k in range(j, n_row * n_col):
    axes[k].axis('off')

plt.tight_layout()
plt.show()


### 90wk
n_row = int(np.ceil(len(deg_90wk_l51["gene"]) / n_col))
fig, axes = plt.subplots(n_row, n_col, figsize=(n_col * 3, n_row * 4))
axes = axes.flatten()

j = 0
for i, gene in enumerate(deg_90wk_l51["gene"]):

    if gene in adata_sub_90wk_l51.var_names:
        expr = adata_sub_90wk_l51[:, gene].X.copy()
        if not isinstance(expr, np.ndarray):
            expr = expr.toarray().flatten()
        else:
            expr = expr.flatten()
    else:
        print(f"{gene} not found in var_names")
        continue

    df_l51 = adata_sub_90wk_l51.obs[["matched_cluster", 'slice_name']].copy()
    df_l51[gene] = expr

    l51_slice = df_l51.groupby(["slice_name", "matched_cluster"], observed=True)[gene].mean().unstack("matched_cluster")
    l51_slice = l51_slice.dropna(subset=noi_list)
    l51_long = l51_slice.reset_index().melt(id_vars="slice_name", value_vars=noi_list,
                                               var_name='matched_cluster', value_name="Mean expression")

    W_l51, p_l51 = wilcoxon(l51_slice[noi_list[0]], l51_slice[noi_list[1]], alternative="two-sided", zero_method="wilcox")
    if p_l51 >= 0.05:
        continue

    ### plot
    sns.violinplot(data=l51_long, x="matched_cluster", y="Mean expression", order=noi_list,
                   palette={noi_list[0]: niche_color_dict[noi_list[0]], noi_list[1]: niche_color_dict[noi_list[1]]},
                   inner="box", cut=1, scale="width", width=0.7, linewidth=1, ax=axes[j], alpha=0.8)
    # sns.boxplot(data=l51_long, x="matched_cluster", y="Mean expression", order=noi_list,
    #             palette={noi_list[0]: niche_color_dict[noi_list[0]], noi_list[1]: niche_color_dict[noi_list[1]]},
    #             width=0.7, showfliers=False, ax=axes[j], zorder=0, boxprops=dict(alpha=0.8))

    pairs = [(noi_list[0], noi_list[1])]
    annotator = Annotator(axes[j], pairs, data=l51_long, x="matched_cluster", y="Mean expression", order=noi_list)
    annotator.configure(test=None, text_format="full", loc="inside", verbose=0)
    annotator.set_custom_annotations([f"Wilcoxon p = {p_l51:.3e}"])
    annotator.annotate()
    # annotator.configure(test='Wilcoxon', text_format='full', loc='inside', verbose=0)
    # annotator.apply_and_annotate()

    vals_9 = l51_slice[noi_list[0]].values
    vals_2 = l51_slice[noi_list[1]].values
    n = len(vals_9)
    for xpos, vals in zip([0, 1],[vals_9, vals_2]):
        axes[j].hlines(np.median(vals), xpos-0.2, xpos+0.2,color='white', lw=4, zorder=3)
    jitter = 0.15
    for k in range(n):
        x1 = 0 + np.random.uniform(-jitter, jitter)
        x2 = 1 + np.random.uniform(-jitter, jitter)
        y1, y2 = vals_9[k], vals_2[k]
        axes[j].plot([x1, x2], [y1, y2], color='black', linewidth=1, alpha=0.5, zorder=1)
        axes[j].scatter([x1], [y1], color=niche_color_dict[noi_list[0]], s=30, alpha=0.8, edgecolor='black', zorder=2)
        axes[j].scatter([x2], [y2], color=niche_color_dict[noi_list[1]], s=30, alpha=0.8, edgecolor='black', zorder=2)

    axes[j].set_title(f"{gene} (ExN-L5-1 90wk)", fontsize=16)
    axes[j].set_xlabel("Niche", fontsize=14)
    axes[j].set_ylabel("Expression", fontsize=14)
    axes[j].tick_params(axis='x', labelsize=14)
    axes[j].tick_params(axis='y', labelsize=14)

    axes[j].grid(False)
    sns.despine(ax=axes[j], top=True, right=True)
    j += 1

for k in range(j, n_row * n_col):
    axes[k].axis('off')

plt.tight_layout()
plt.show()
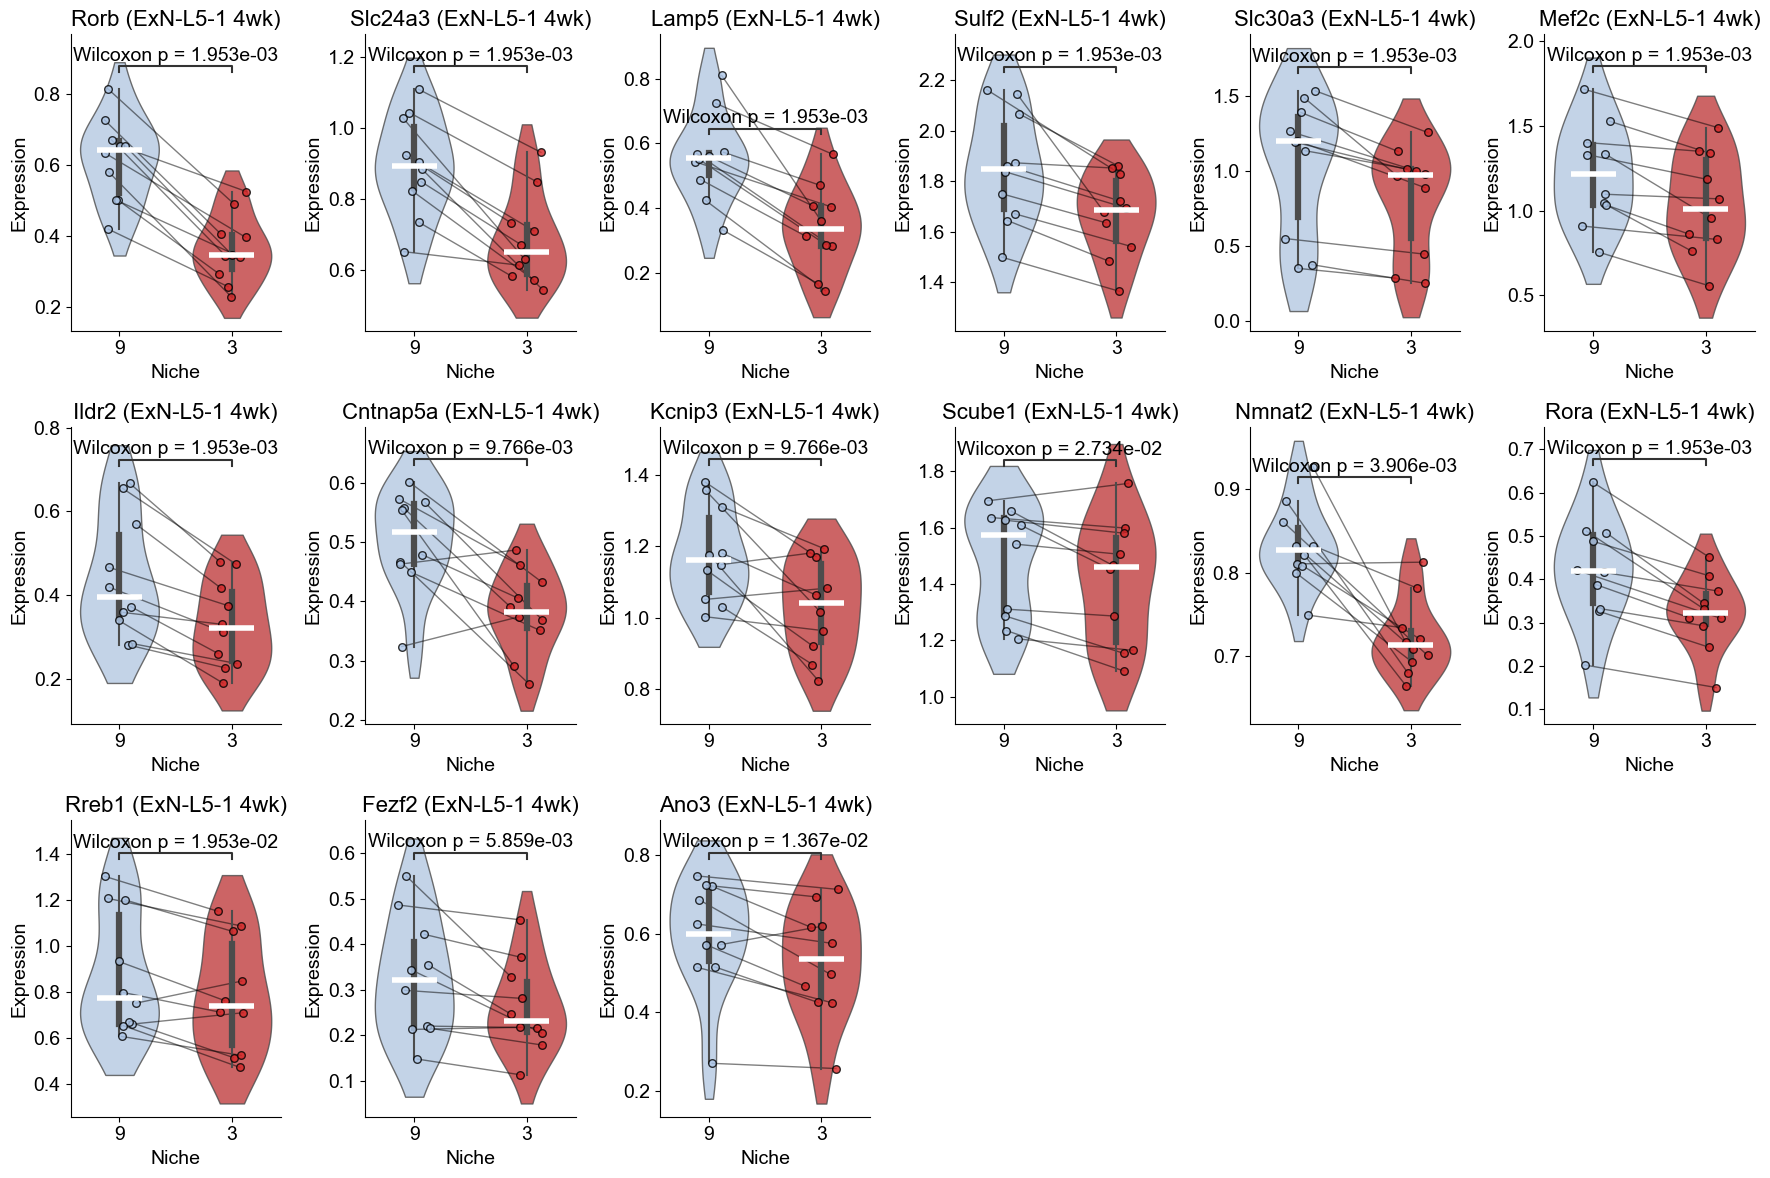
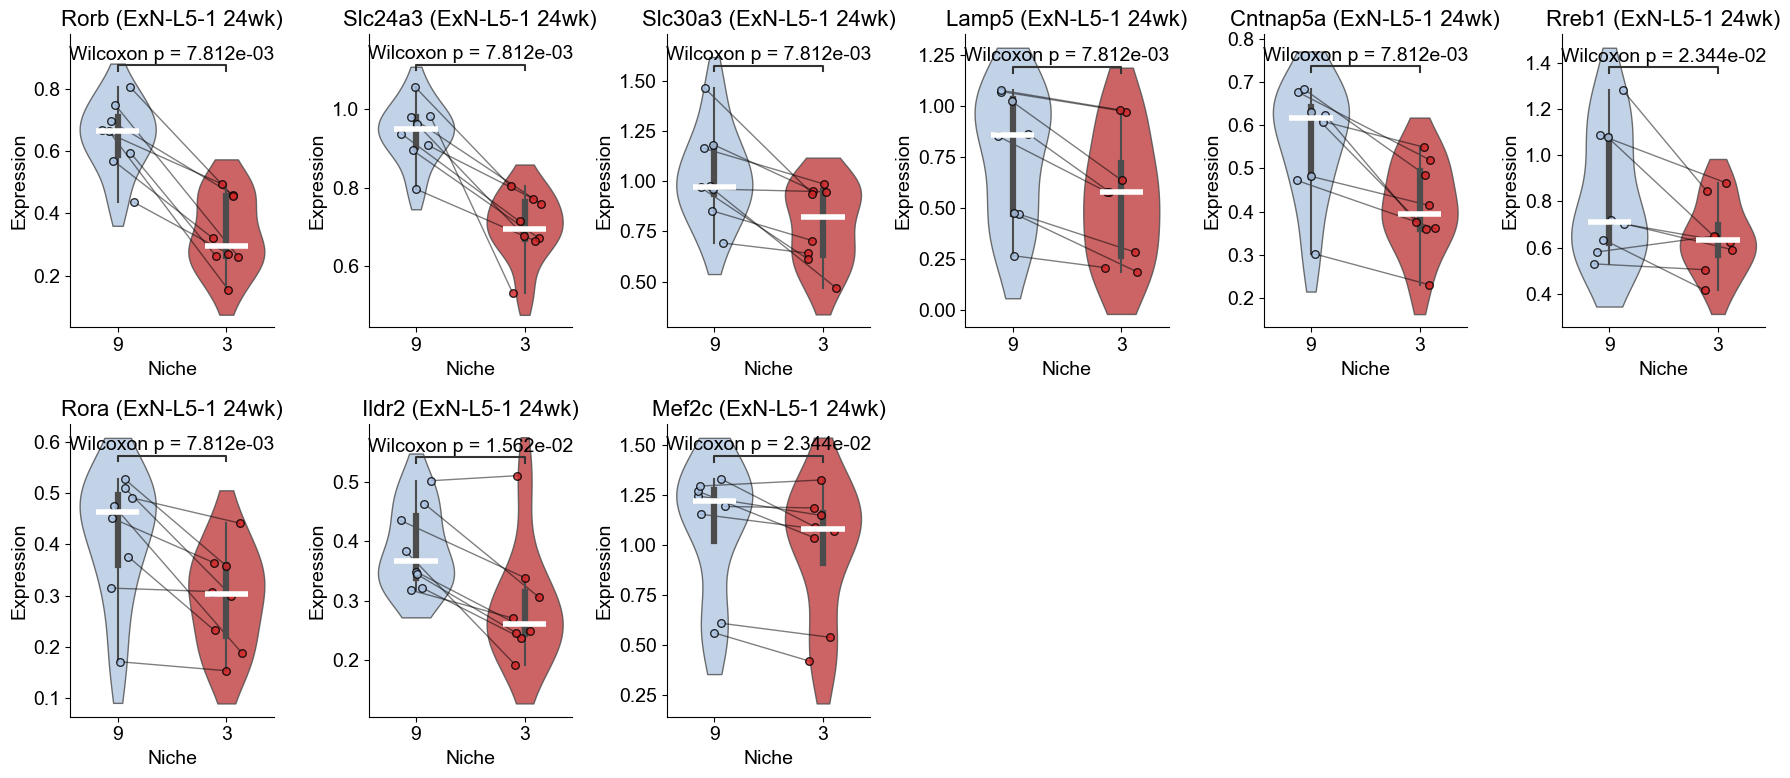
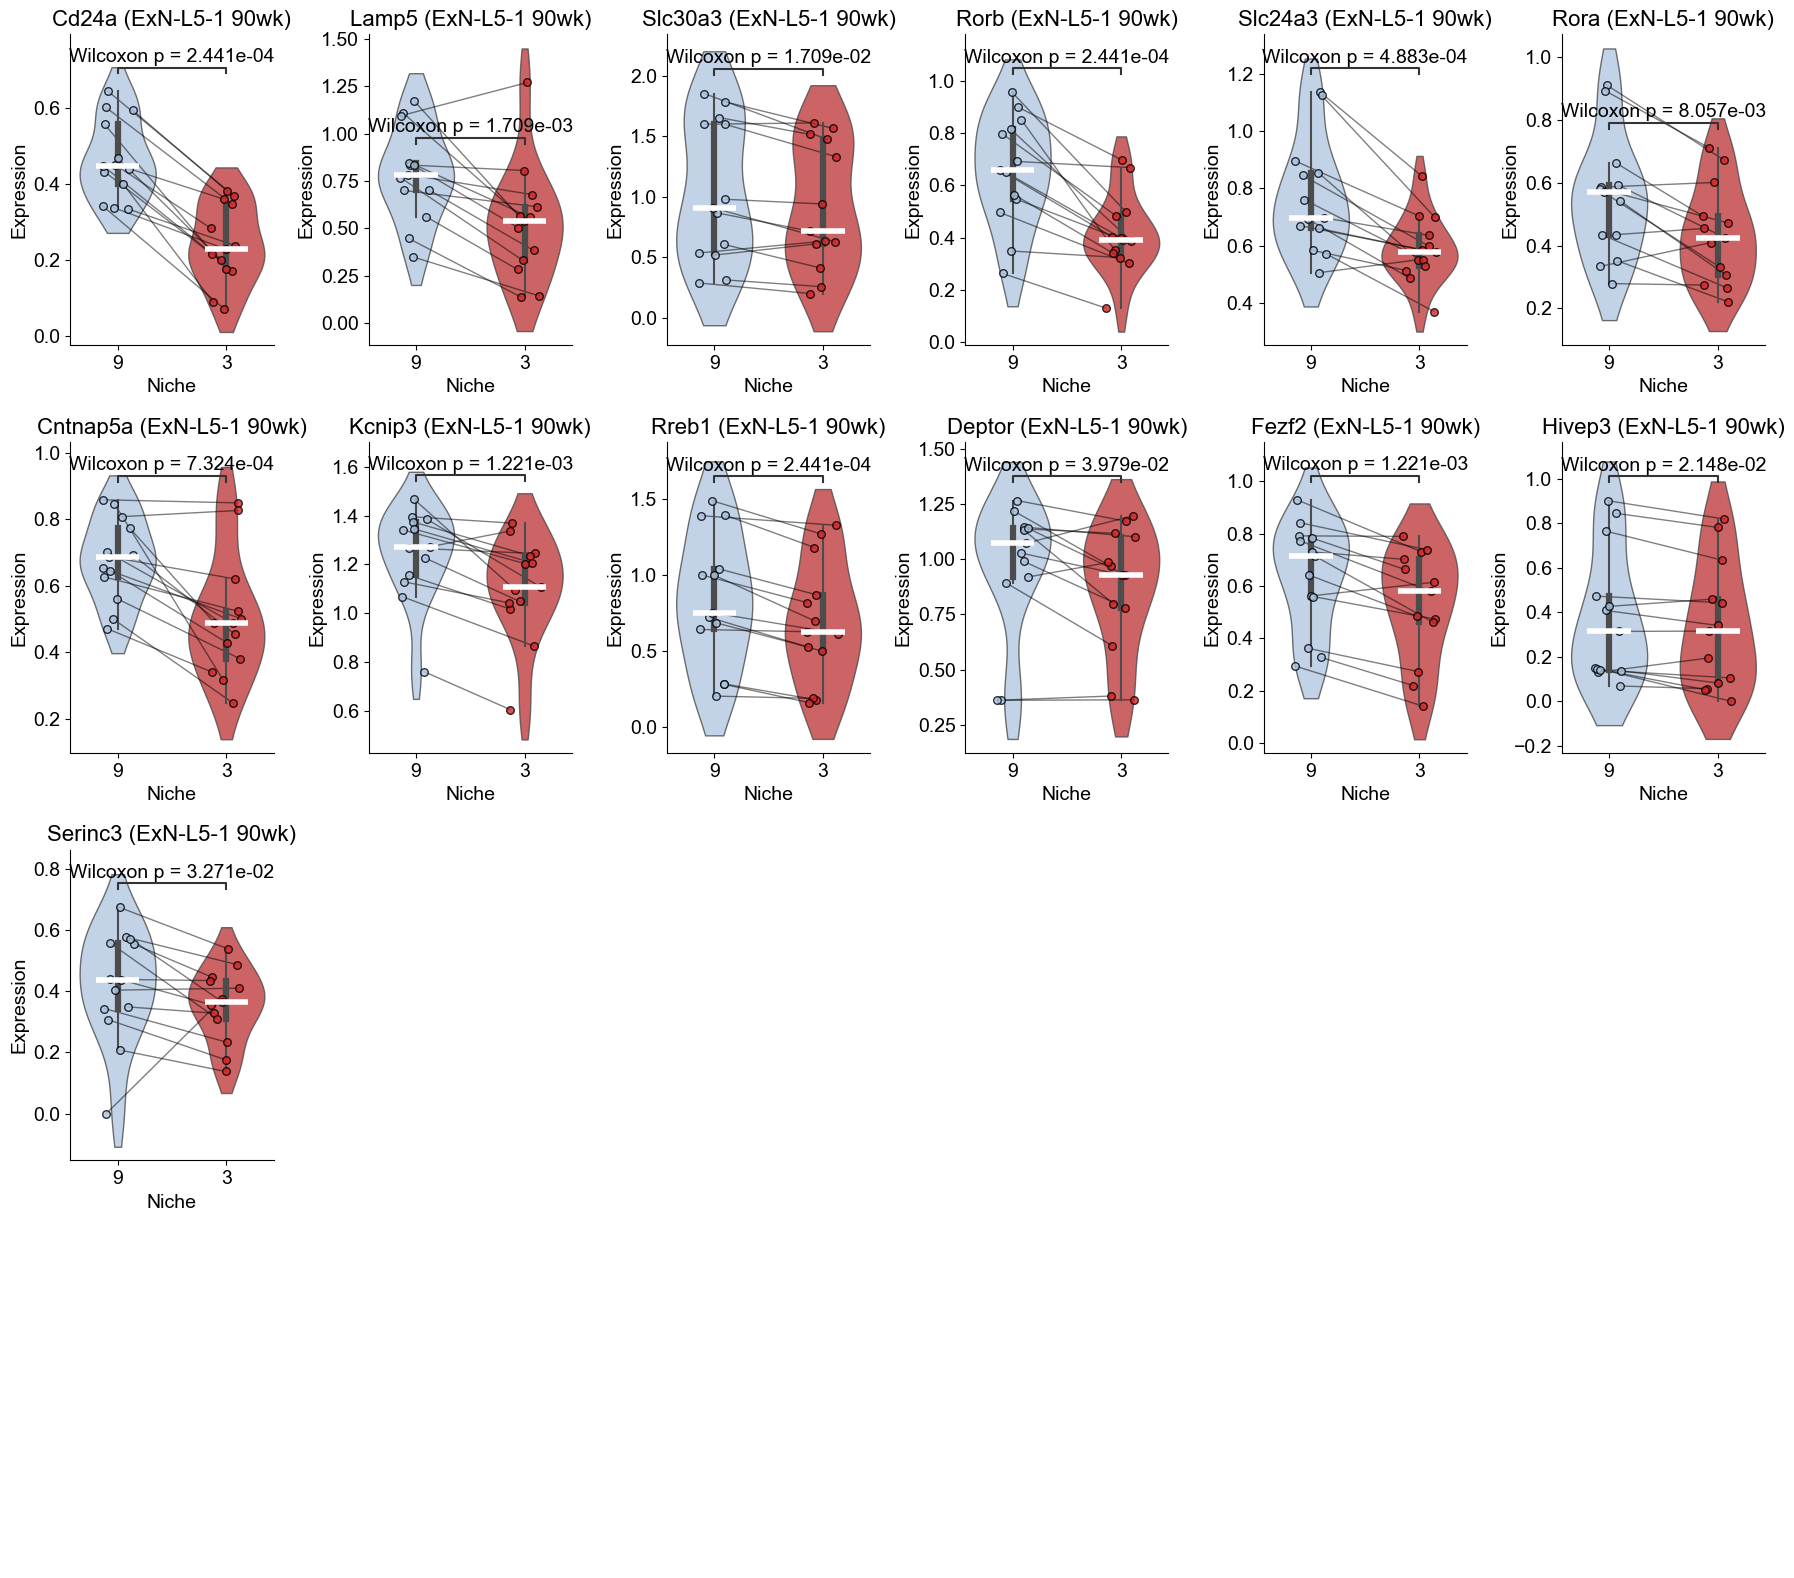
Corpus callosum -> Niche 1 (Olig-2, Olig-3) & 8 (OPC, Olig-1, Olig-2)
[63]:
ct_color_dict.update({'Other': '#D3D3D3'})
niche_color_dict.update({'Other': '#D3D3D3'})

for i in range(len(slice_name_list)):

    print(slice_name_list[i])
    adata = adata_concat[adata_concat.obs['slice_name'] == slice_name_list[i]].copy()
    adata.obs['niche_tmp'] = [ct if ct in ['1', '8'] else 'Other' for ct in adata.obs['matched_cluster']]
    adata.obs['ct_tmp'] = [ct if (ct in ['OPC', 'Olig-1', 'Olig-2', 'Olig-3']) and (adata.obs['niche_tmp'][idx] != 'Other')
                           else 'Other' for idx, ct in enumerate(adata.obs['celltype_43'])]

    fig, axes = plt.subplots(1, 2, figsize=(11.5, 5))

    adata_other = adata[adata.obs['niche_tmp'] == 'Other'].copy()
    sc.pl.embedding(adata_other, basis='spatial', palette=niche_color_dict, color='niche_tmp',
                    ax=axes[0], s=50, show=False, frameon=False, title='Cell Niche (matched)', legend_fontsize=16)

    adata_sub = adata[adata.obs['niche_tmp'] != 'Other'].copy()
    sc.pl.embedding(adata_sub[adata_sub.obs['ct_tmp'] == 'Olig-2'], basis='spatial', palette=niche_color_dict, color='niche_tmp',
                    ax=axes[0], s=50, show=False, frameon=False, title='Cell Niche (matched)', legend_loc=None)
    sc.pl.embedding(adata_sub[adata_sub.obs['ct_tmp'] != 'Olig-2'], basis='spatial', palette=niche_color_dict, color='niche_tmp',
                    ax=axes[0], s=50, show=False, frameon=False, title='Cell Niche (matched)', legend_fontsize=16)

    adata_other = adata[adata.obs['ct_tmp'] == 'Other'].copy()
    sc.pl.embedding(adata_other, basis='spatial', palette=ct_color_dict, color='ct_tmp',
                    ax=axes[1], s=50, show=False, frameon=False, title='Cell Type', legend_fontsize=16)

    adata_sub = adata[adata.obs['ct_tmp'] != 'Other'].copy()
    sc.pl.embedding(adata_sub[adata_sub.obs['ct_tmp'] == 'Olig-2'], basis='spatial', palette=ct_color_dict, color='ct_tmp',
                    ax=axes[1], s=50, show=False, frameon=False, title='Cell Type', legend_fontsize=16)
    sc.pl.embedding(adata_sub[adata_sub.obs['ct_tmp'] != 'Olig-2'], basis='spatial', palette=ct_color_dict, color='ct_tmp',
                    ax=axes[1], s=50, show=False, frameon=False, title='Cell Type', legend_fontsize=16)

    plt.tight_layout()
    plt.show()
Donor1_Slice0_4wk
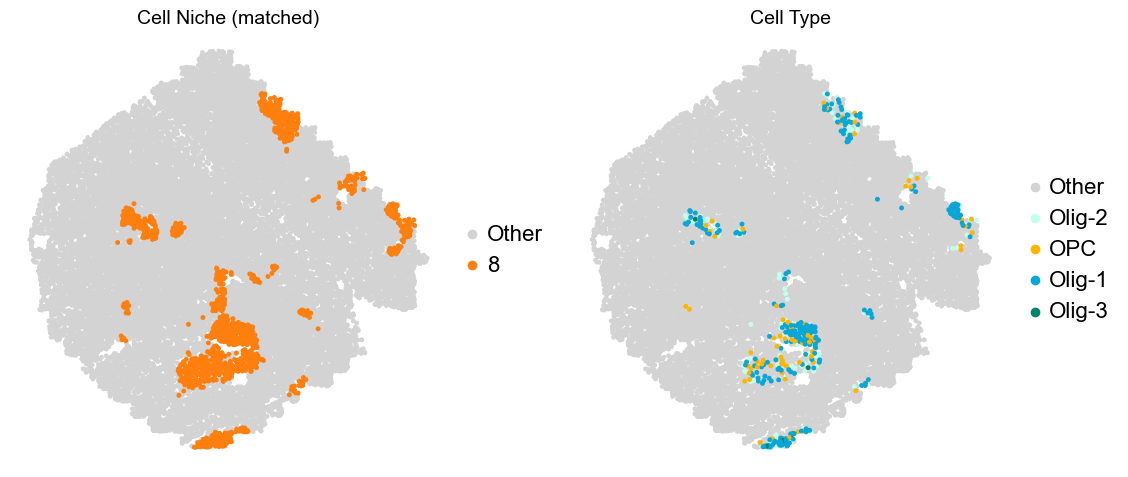
Donor4_Slice0_4wk
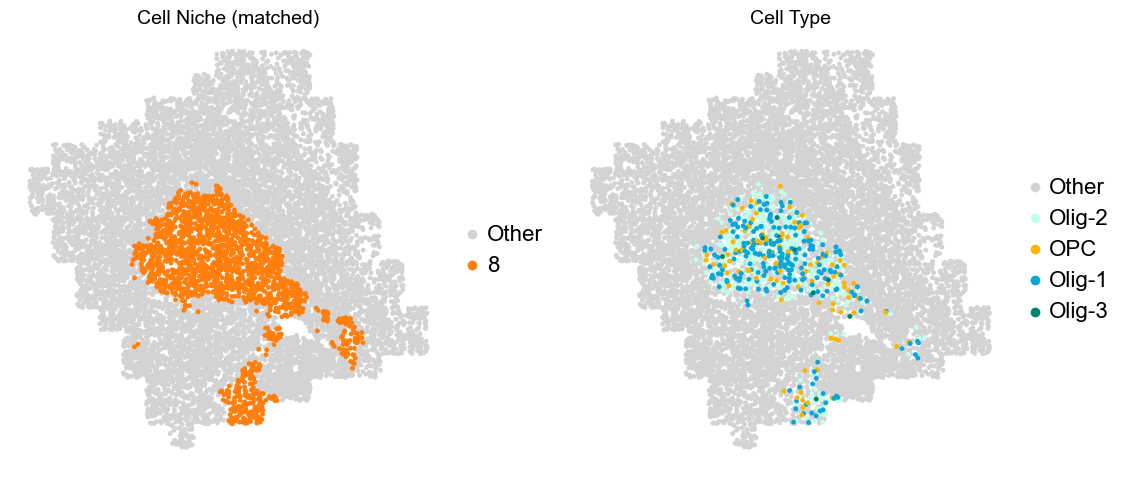
Donor4_Slice1_4wk
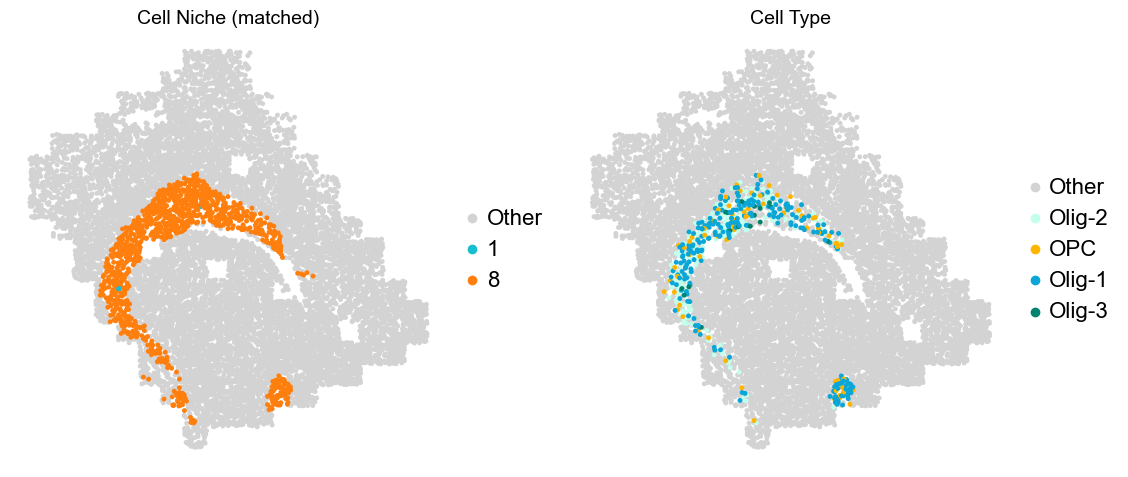
Donor4_Slice2_4wk
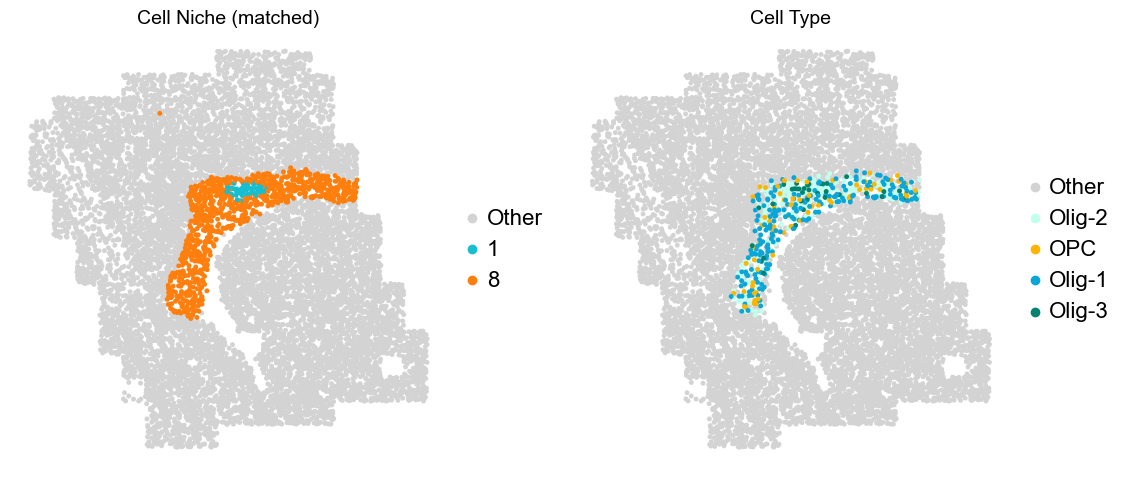
Donor7_Slice0_4wk
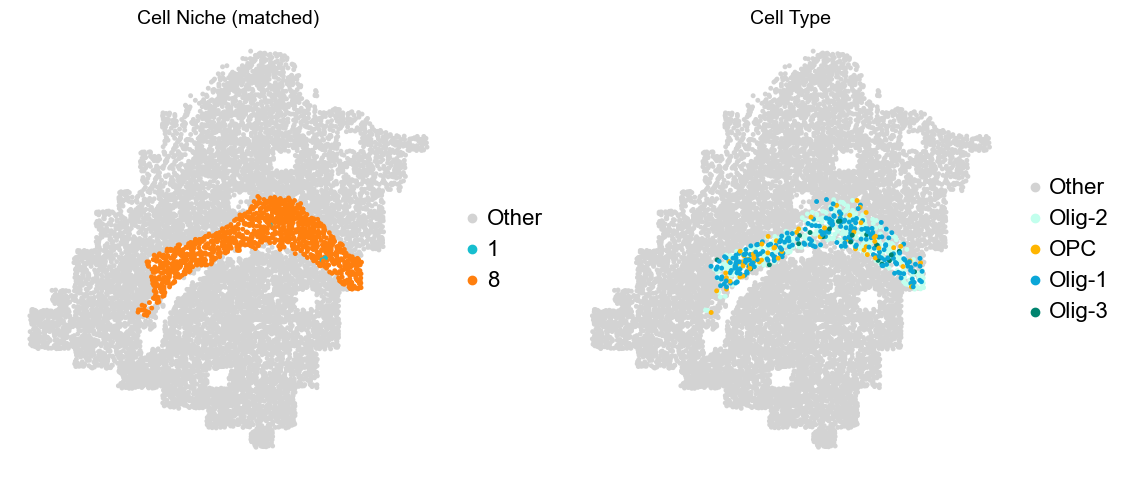
Donor7_Slice1_4wk
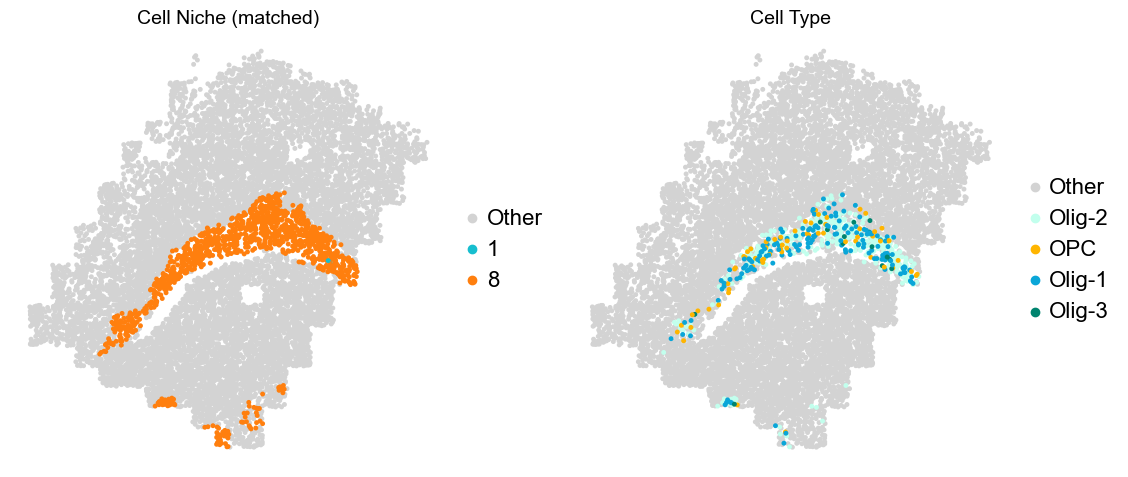
Donor7_Slice2_4wk
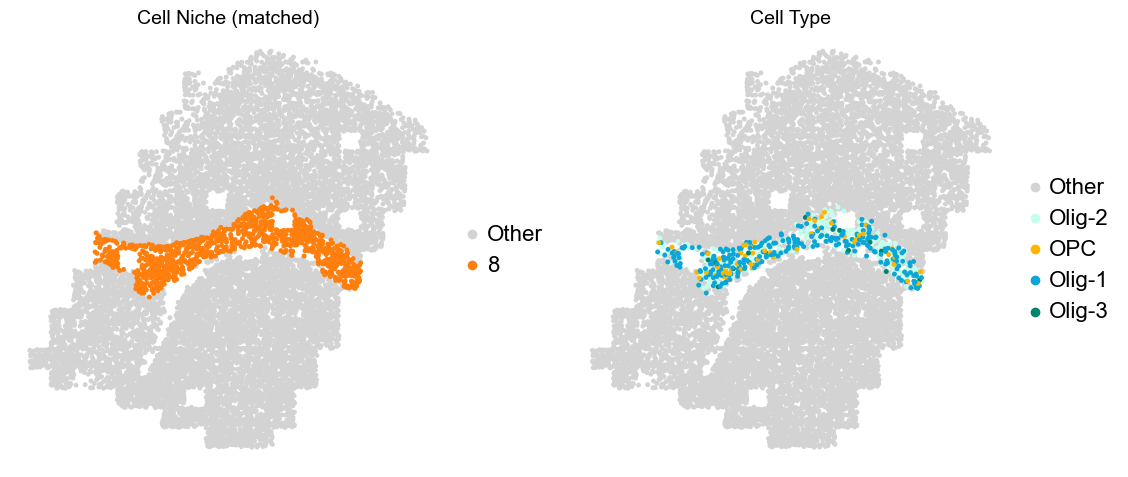
Donor8_Slice0_4wk
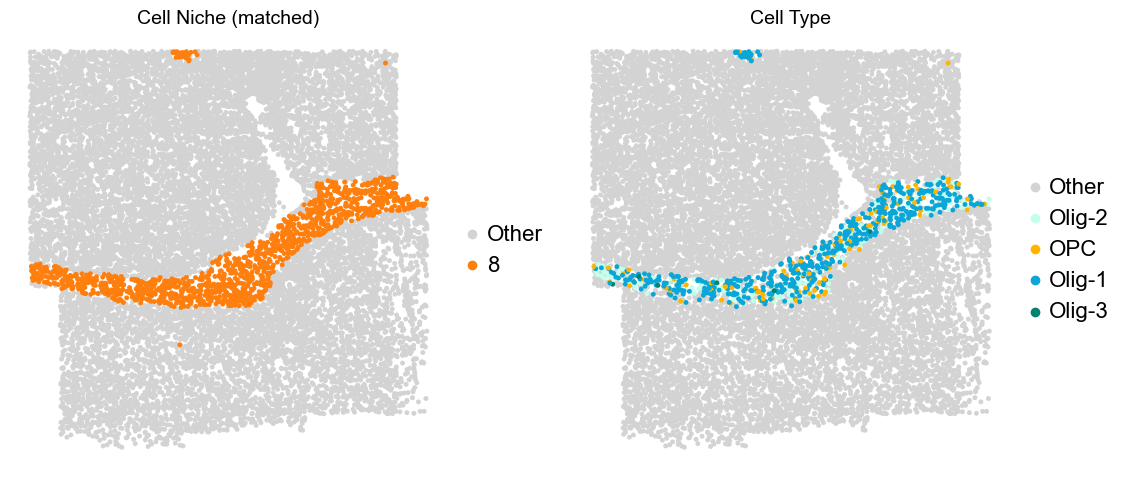
Donor8_Slice1_4wk
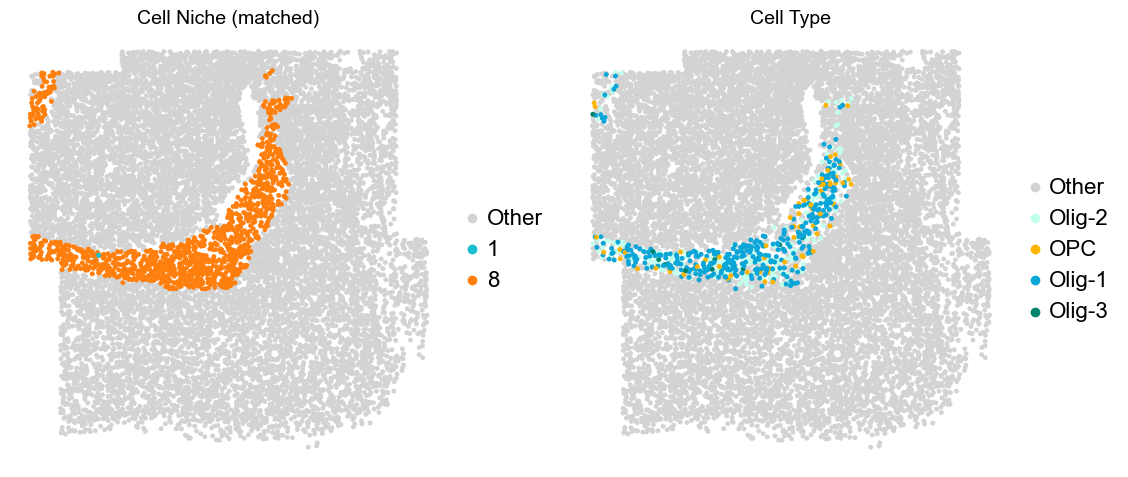
Donor8_Slice2_4wk
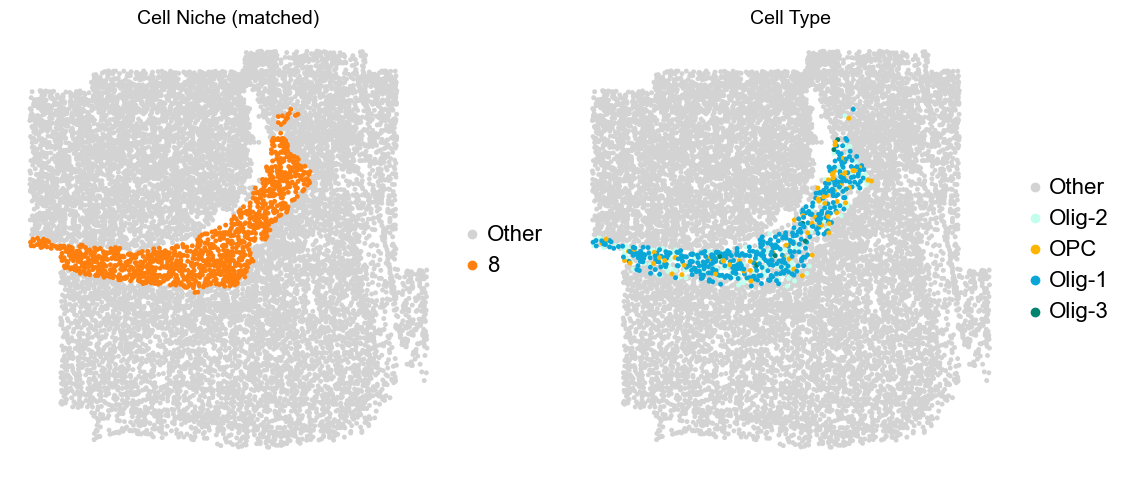
Donor10_Slice0_24wk
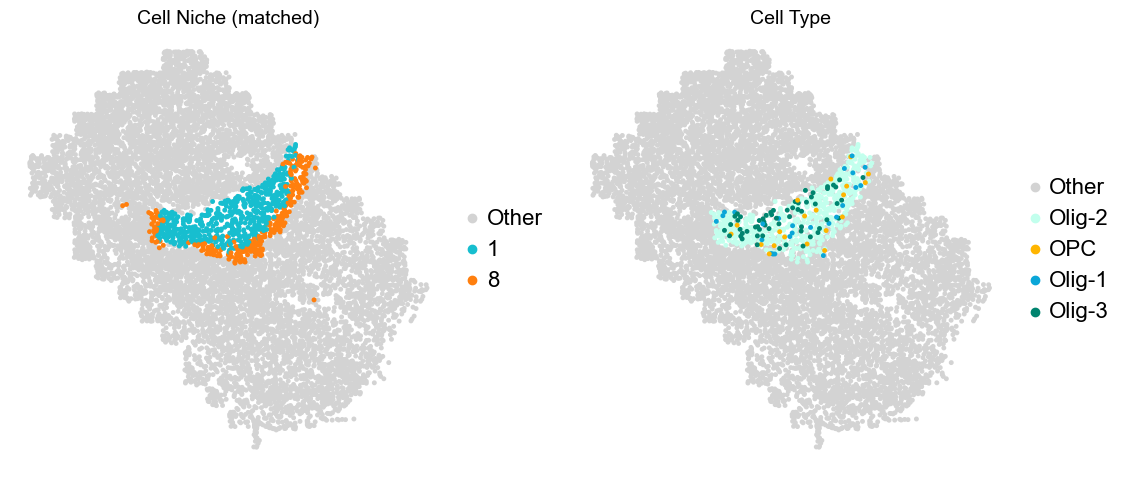
Donor10_Slice1_24wk
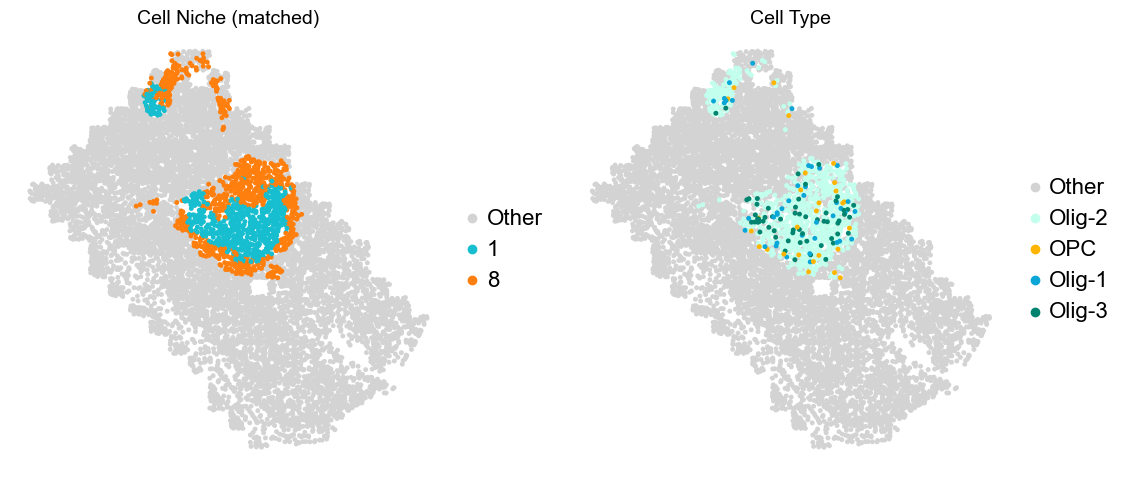
Donor10_Slice2_24wk
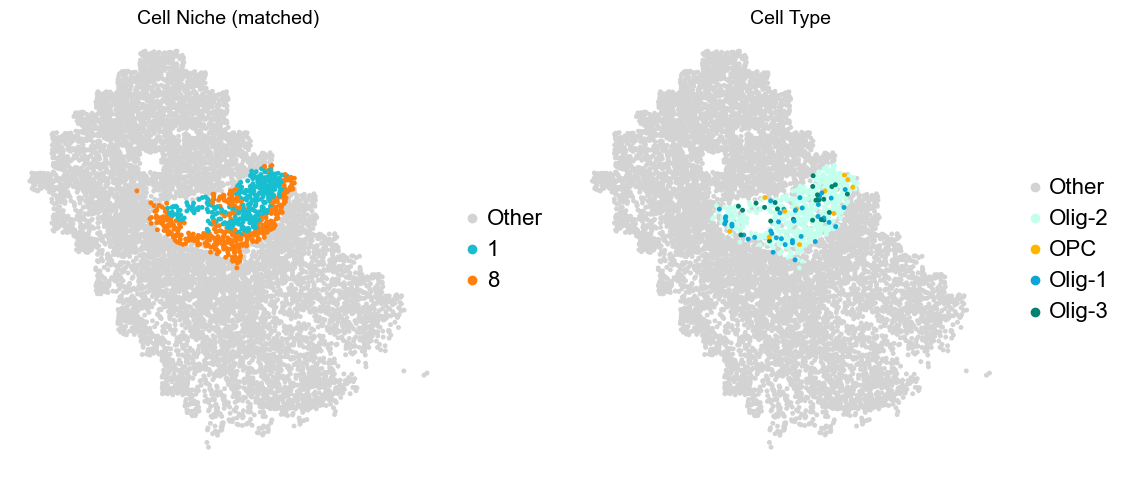
Donor11_Slice0_24wk
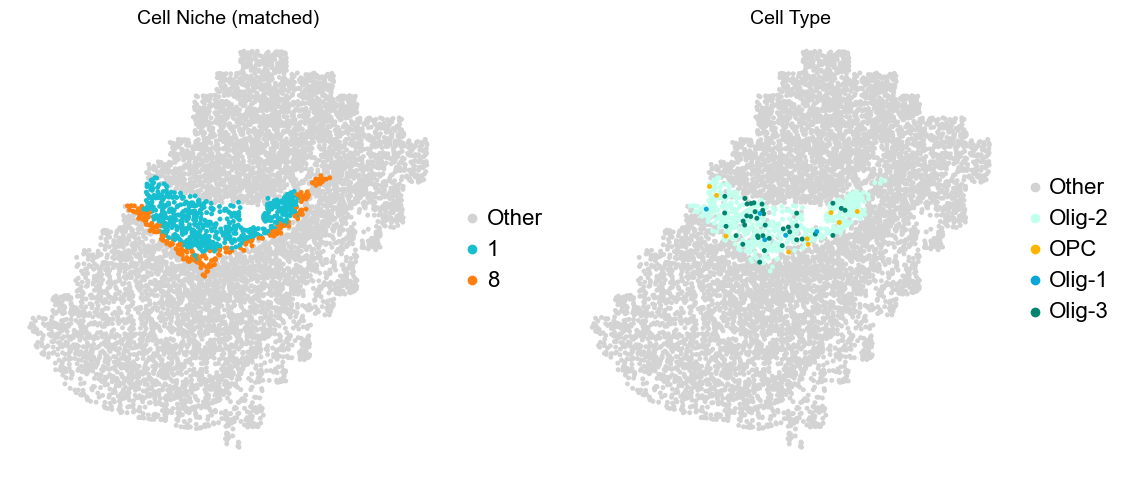
Donor11_Slice1_24wk
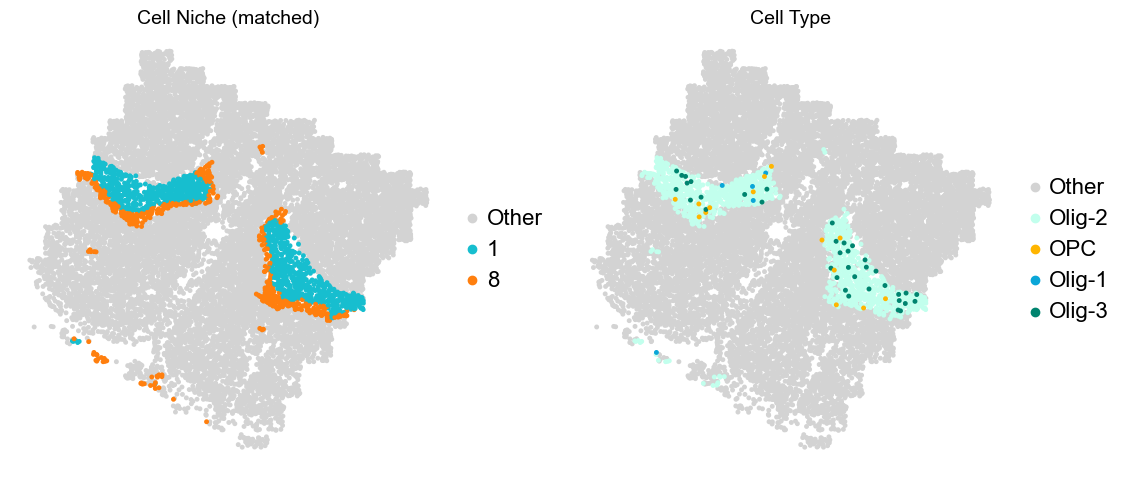
Donor11_Slice2_24wk
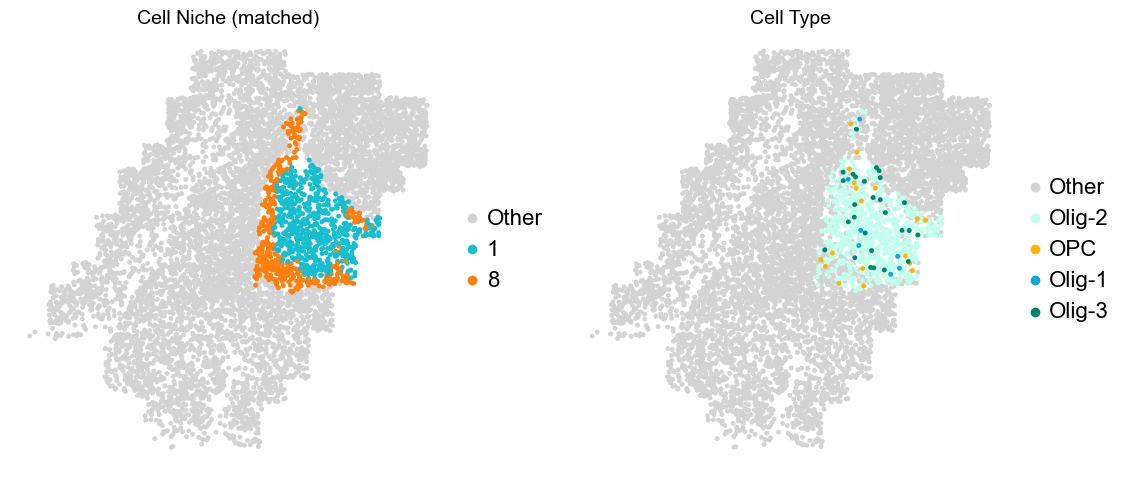
Donor12_Slice0_24wk
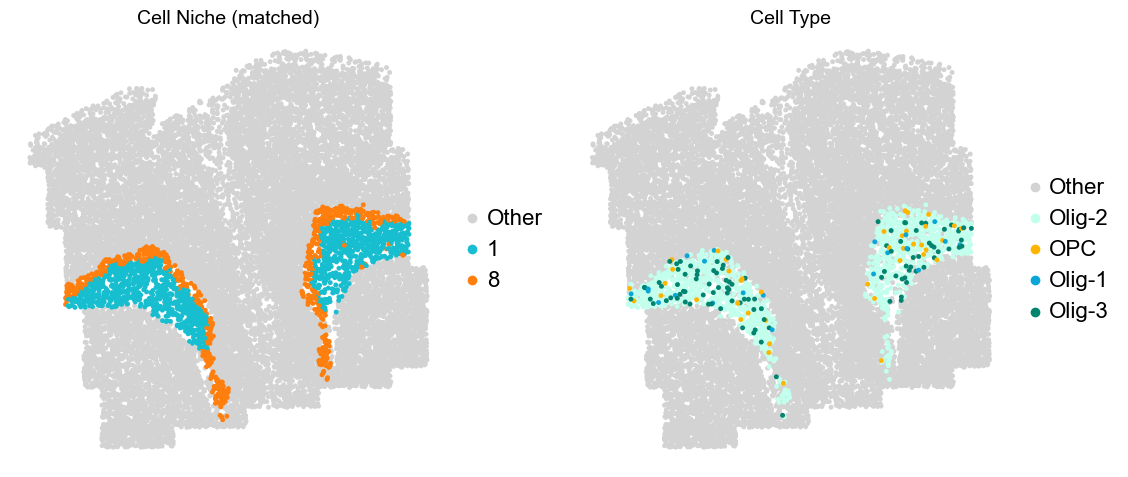
Donor12_Slice1_24wk
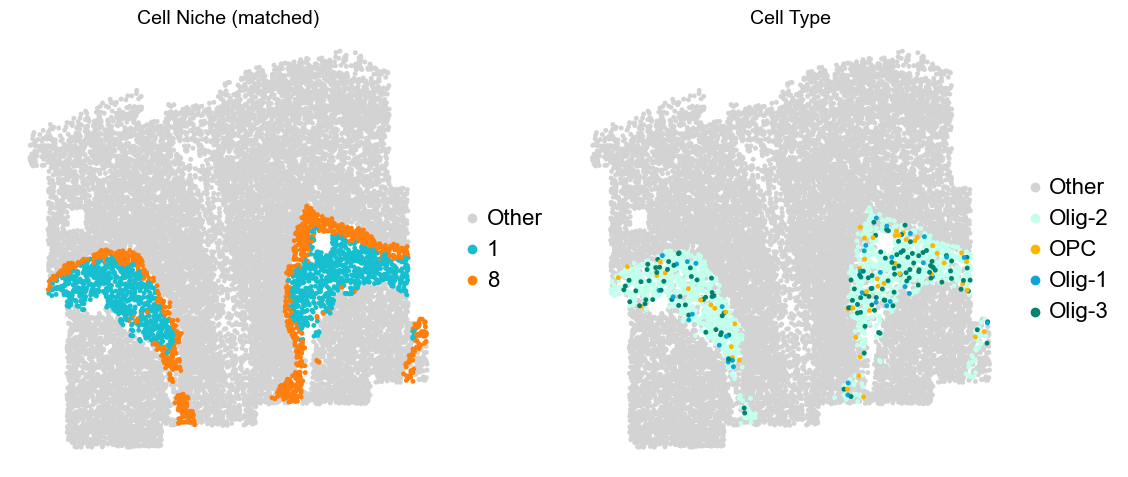
Donor2_Slice0_90wk
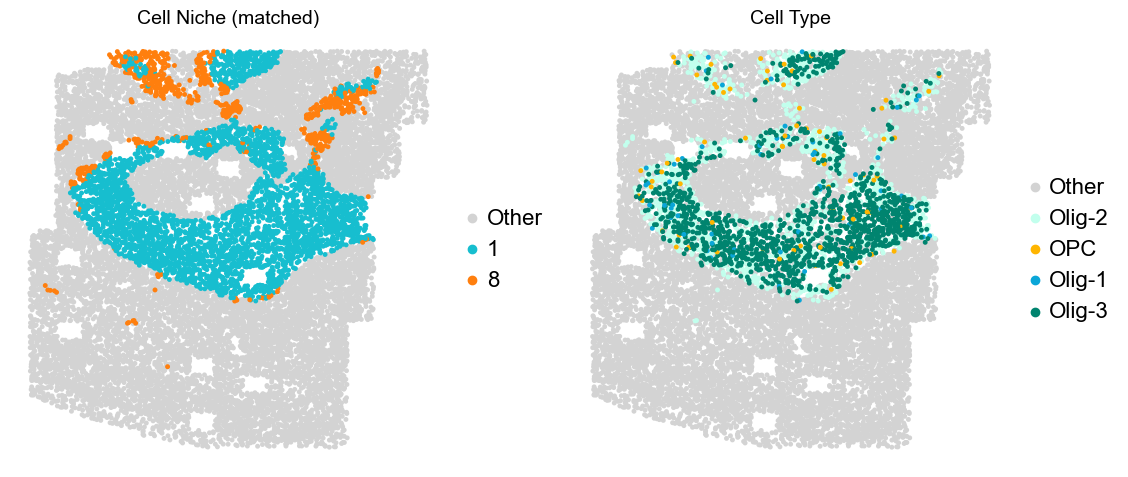
Donor2_Slice1_90wk
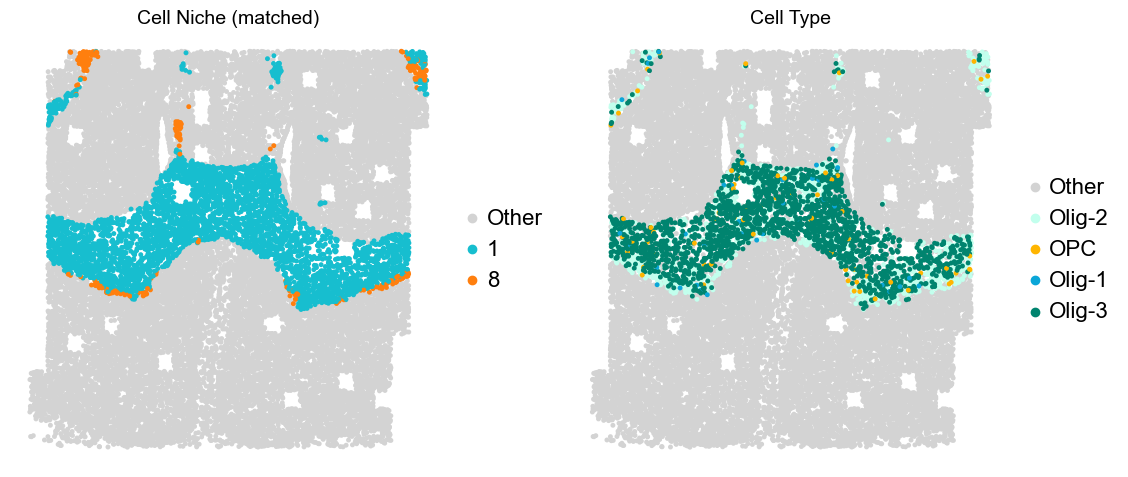
Donor3_Slice0_90wk
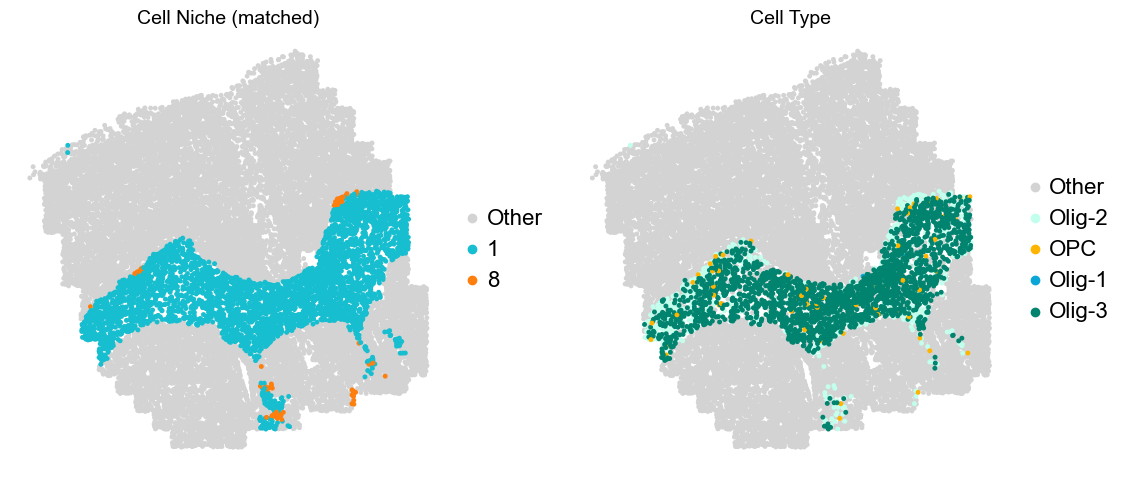
Donor3_Slice1_90wk
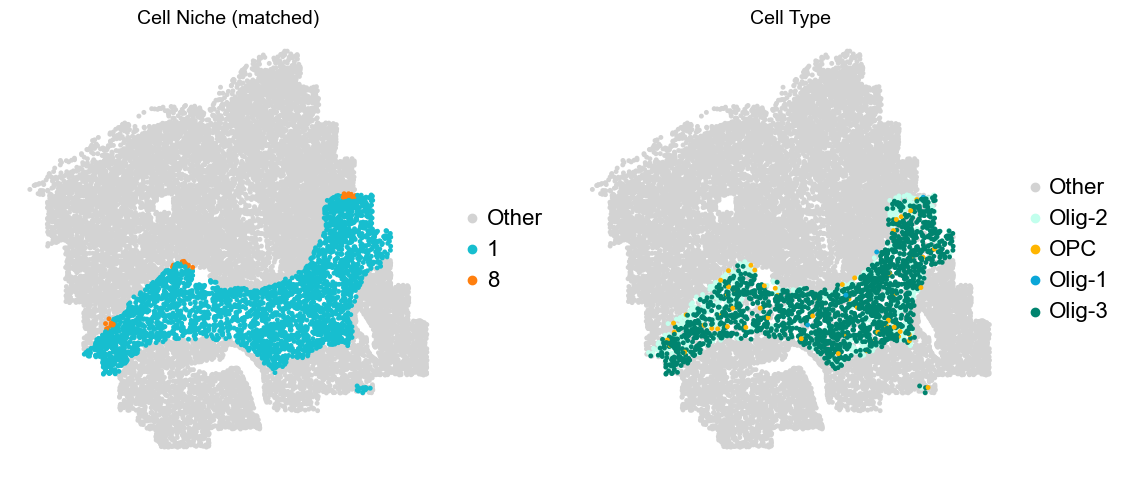
Donor5_Slice0_90wk
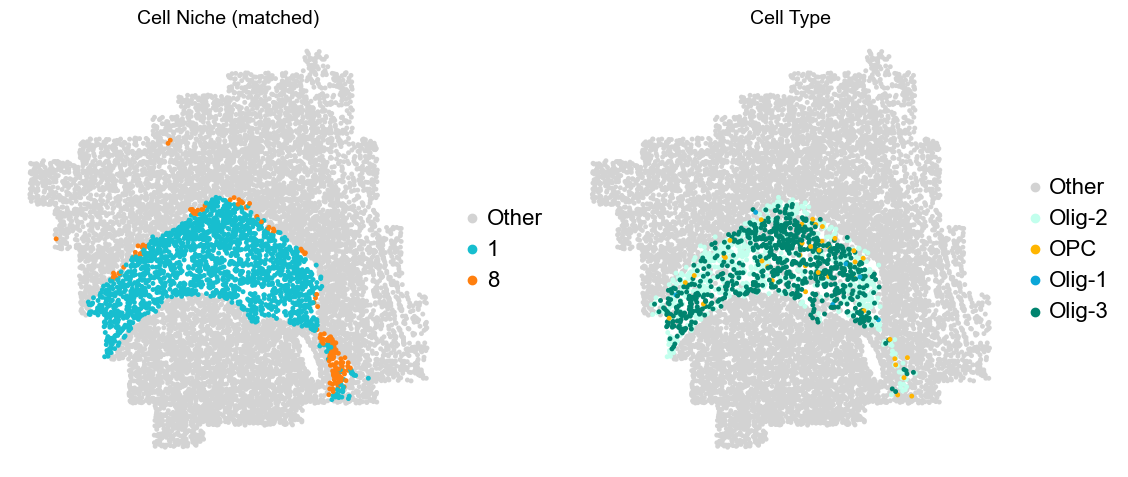
Donor5_Slice1_90wk
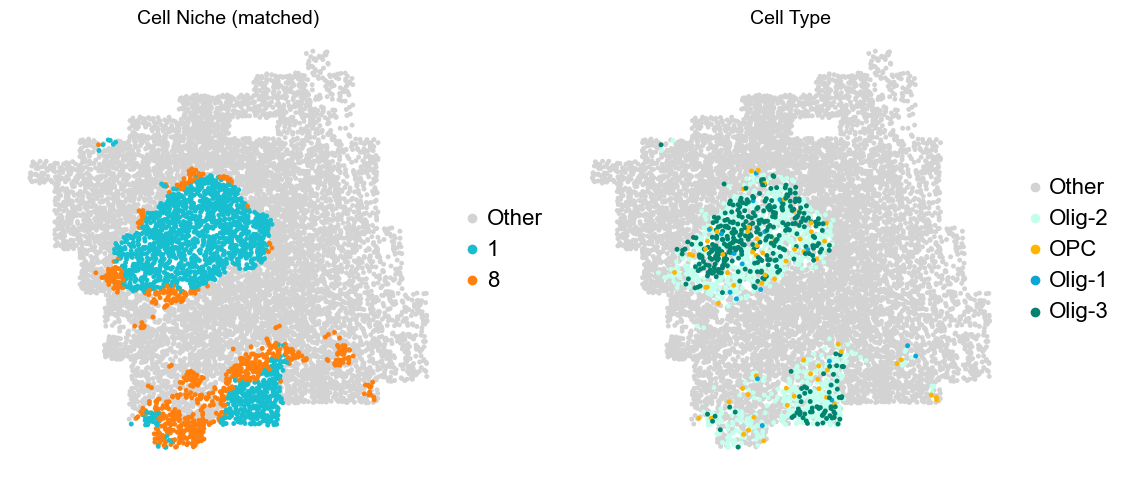
Donor5_Slice2_90wk
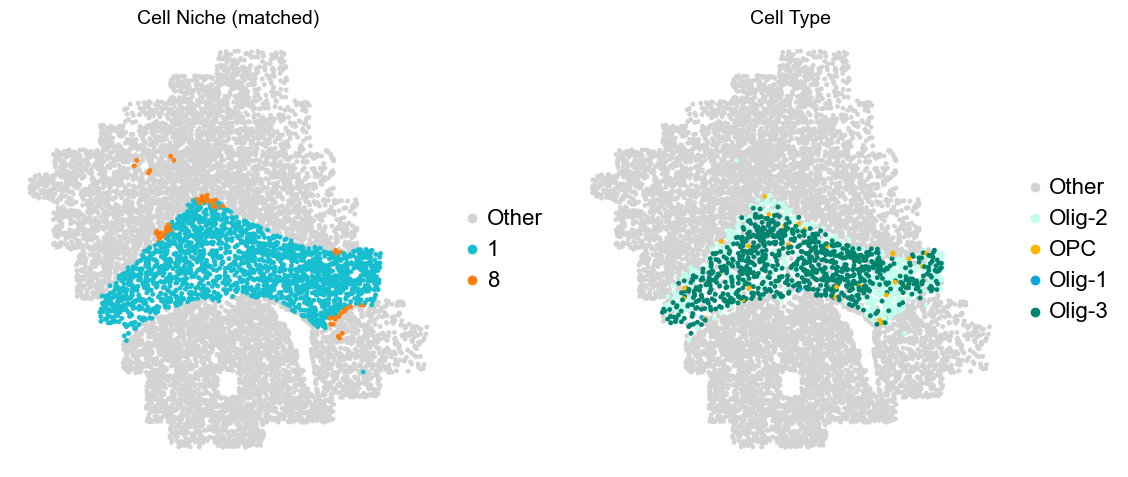
Donor6_Slice0_90wk
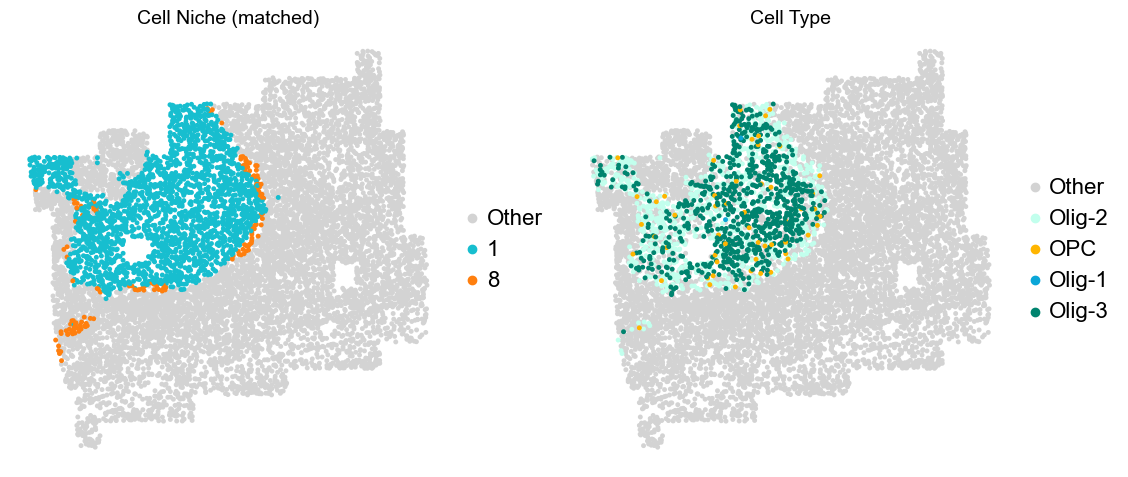
Donor6_Slice1_90wk
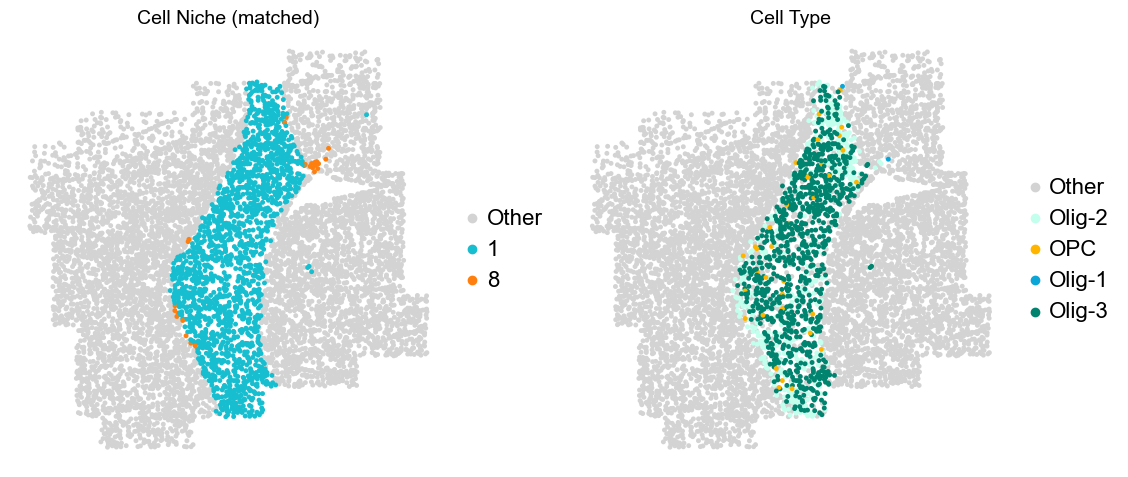
Donor6_Slice2_90wk
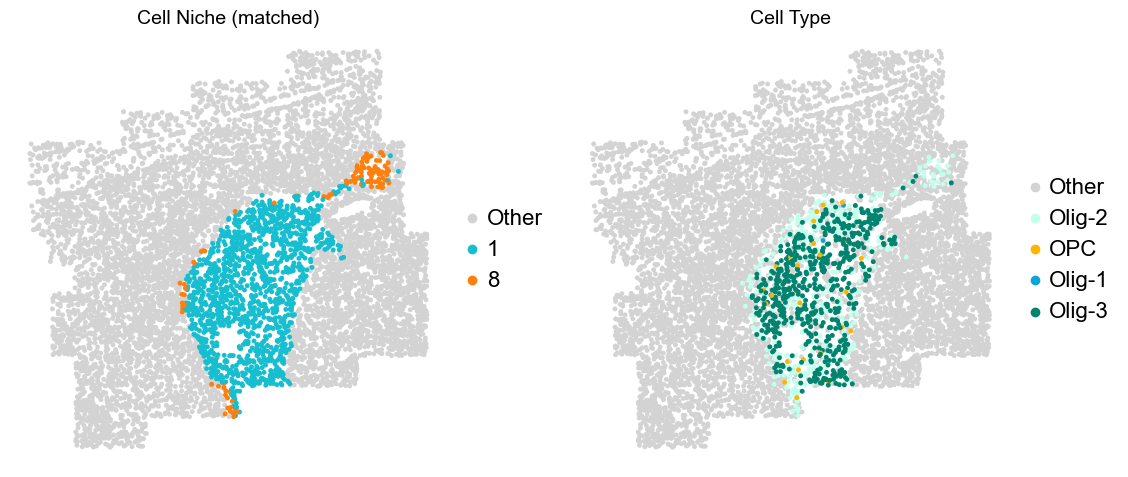
Donor9_Slice0_90wk
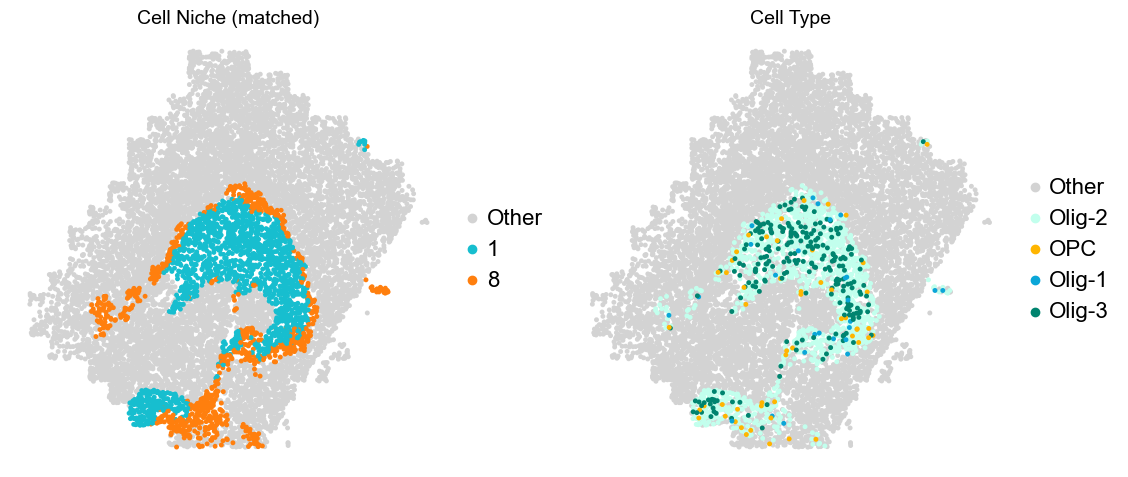
Donor9_Slice1_90wk
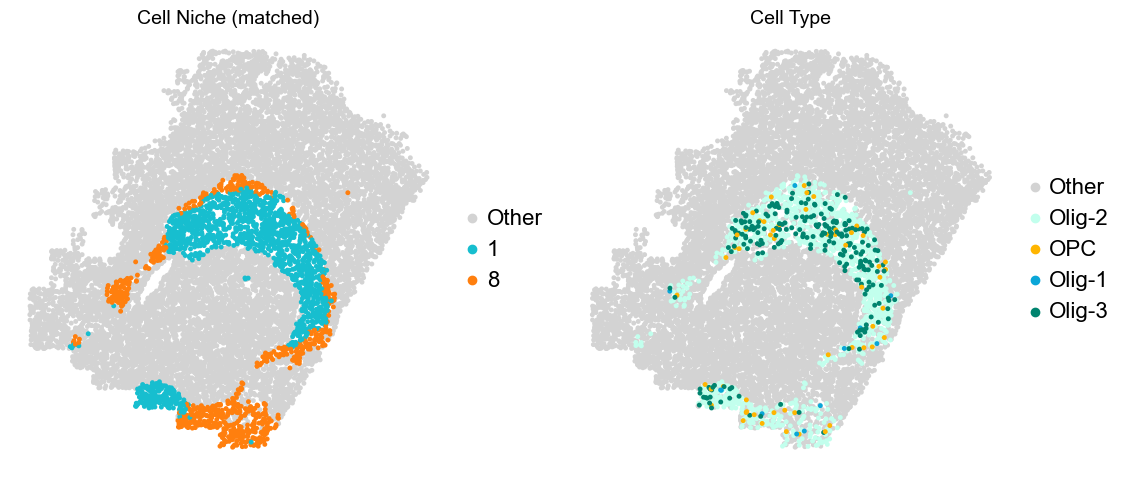
Donor9_Slice2_90wk
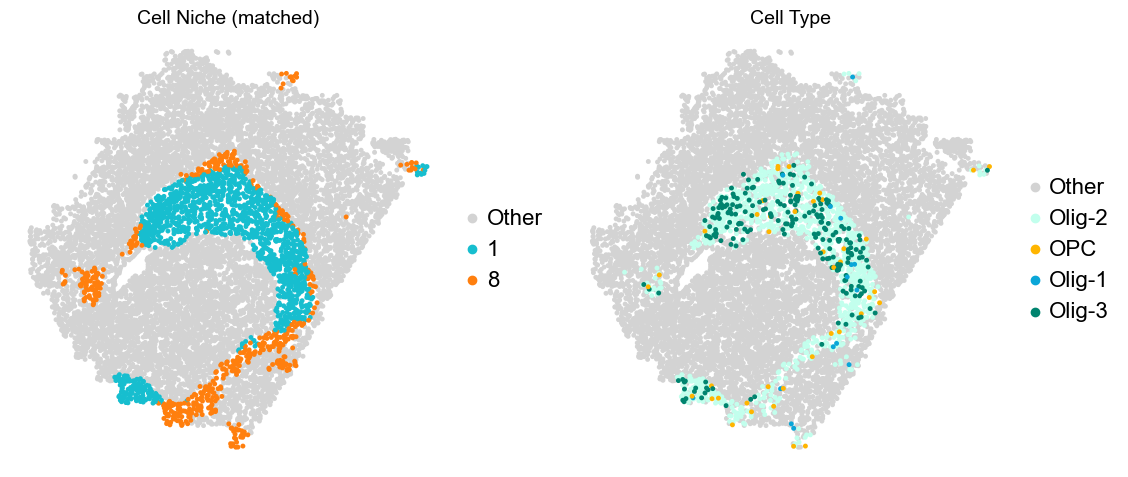
[65]:
tgt_niches = ["8", "1"]
obs = adata_concat.obs.copy()
mask = obs['matched_cluster'].isin(tgt_niches)
df = obs.loc[mask, ['age', 'matched_cluster', 'celltype_43']].copy()

age_groups = ["4wk", "24wk", "90wk"]


df_ct = df[df['celltype_43'].isin(["OPC", "Olig-1", "Olig-2", "Olig-3"])].copy()
ct_counts = (
    df_ct.groupby(['age', 'celltype_43'])
         .size()
         .unstack('celltype_43', fill_value=0)
         .reindex(index=age_groups, columns=["OPC", "Olig-1", "Olig-2", "Olig-3"], fill_value=0)
)
ct_total = ct_counts.sum(axis=1).replace(0, np.nan)
ct_frac = ct_counts.div(ct_total, axis=0).fillna(0.0)


df_ct2 = df[df['celltype_43'].isin(["OPC", "Olig-1", "Olig-3"])].copy()
ct_counts = (
    df_ct2.groupby(['age', 'celltype_43'])
         .size()
         .unstack('celltype_43', fill_value=0)
         .reindex(index=age_groups, columns=["OPC", "Olig-1", "Olig-3"], fill_value=0)
)
ct_total2 = ct_counts.sum(axis=1).replace(0, np.nan)
ct_frac2 = ct_counts.div(ct_total2, axis=0).fillna(0.0)


niche_counts = (
    df.groupby(['age', 'matched_cluster'])
      .size()
      .unstack('matched_cluster', fill_value=0)
      .reindex(index=age_groups, columns=tgt_niches, fill_value=0)
)
niche_total = niche_counts.sum(axis=1).replace(0, np.nan)
niche_frac = niche_counts.div(niche_total, axis=0).fillna(0.0)


fig, axes = plt.subplots(1, 3, figsize=(10, 4))
bar_width = 0.7

x = np.arange(len(age_groups))

bottom = np.zeros(len(age_groups))
axes[0].set_title('Cell Type Composition', fontsize=16)
target_ct = ["OPC", "Olig-1", "Olig-2", "Olig-3"]
for ct in target_ct:
    axes[0].bar(x,
                ct_frac[ct].values,
                bottom=bottom,
                width=bar_width,
                color=ct_color_dict[ct],
                label=ct)
    bottom += ct_frac[ct].values

bottom = np.zeros(len(age_groups))
target_ct = ["OPC", "Olig-1", "Olig-3"]
axes[1].set_title('Cell Type Composition', fontsize=16)
for ct in target_ct:
    axes[1].bar(x,
                ct_frac2[ct].values,
                bottom=bottom,
                width=bar_width,
                color=ct_color_dict[ct],
                label=ct)
    bottom += ct_frac2[ct].values

bottom = np.zeros(len(age_groups))
axes[2].set_title('Niche Composition', fontsize=16)
for nn in tgt_niches:
    axes[2].bar(x,
                niche_frac[nn].values,
                bottom=bottom,
                width=bar_width,
                color=niche_color_dict[nn],
                label=nn)
    bottom += niche_frac[nn].values

for ax in axes:
    ax.set_ylabel('Proportion', fontsize=16)
    ax.set_xlabel('Age', fontsize=16)
    ax.set_xticks(x)
    ax.set_xticklabels(age_groups, rotation=0, ha='center')
    ax.tick_params(axis='x', labelsize=16)
    ax.tick_params(axis='y', labelsize=16)
    ax.spines['top'].set_visible(False)
    ax.spines['right'].set_visible(False)
    ax.grid(False)

# handles = [
#     mpatches.Patch(color=color, label=ct)
#     for ct, color in zip(celltypes, ct_colors)
# ]

# ax.legend(handles=handles, title='Cell Types', loc=(1.05, 0.0), frameon=False, handleheight=0.8,
#           handlelength=0.7, ncol=3, fontsize=14, title_fontsize=14)

plt.tight_layout()
plt.show()