Tutorial for CODEX CRC dataset
Need additional packages: scanpy seaborn
Load the packages
[1]:
%reload_ext autoreload
%autoreload 2

import os
import time
import scanpy as sc
import pandas as pd
import numpy as np
import anndata as ad
import seaborn as sns
import matplotlib.pyplot as plt
from matplotlib.lines import Line2D
import matplotlib.lines as mlines
import matplotlib.patches as mpatches

from Harmonics import *

import warnings
warnings.filterwarnings("ignore")

sc.settings.verbosity = 0
sc.settings.set_figure_params(dpi=30, dpi_save=500)

from matplotlib import rcParams
rcParams["figure.dpi"] = 30
rcParams["savefig.dpi"] = 500
rcParams['pdf.fonttype'] = 42
rcParams['svg.fonttype'] = 'none'
rcParams['ps.fonttype'] = 42
# rcParams['font.family'] = 'Arial'
rcParams['savefig.transparent'] = True
[ ]:
data_dir = '../../../Data/Spatial/Proteomics/CODEX_CRC_Schurch2020/processed/'
save_dir = '../../results/CODEX_CRC_Schurch2020/Harmonics/'
if not os.path.exists(save_dir):
    os.makedirs(save_dir)
Define the function to change p values to corresponding star representation, used to show the results of additional tests implemented in Harmonics
[4]:
def p2stars(p):
    if p < 0.001:
        return '***'
    elif p < 0.01:
        return '**'
    elif p < 0.05:
        return '*'
    else:
        return ''
Load dataset
Three slices with unidentified immune cells exceeding 50% of total cells are removed
Use DII group as the control group and CLR group as the case group
[5]:
fname_list = np.loadtxt(data_dir + f"file_name_list.txt", dtype=str, delimiter=" ").tolist()

adata_list = []
slice_name_list = []
cond_list = []
cond_name_list = []
for fname in fname_list:
    adata = ad.read_h5ad(data_dir + fname + '.h5ad')

    # adata = adata[adata.obs['ClusterName'] != 'undefined', :].copy()

    # filter out slices with other immune cell comprising over 50% of cells
    other_prop = np.sum(adata.obs['ClusterName'] == 'immune cells').astype(int) / adata.shape[0]
    if other_prop > 0.5:
        print(f'Filtering out sample {fname} due to high proportion of unidentified immune cells ({other_prop*100:.2f}%)')
        continue

    # if adata.shape[0] < 500:
    #     print(f'Filtering out sample {fname} due to low cell number ({adata.shape[0]})')
    #     continue

    patient = adata.obs['patients'][0]
    group = adata.obs['groups'][0]
    if group == '1': # group 1: CLR
        cond_list.append(adata)
        cond_name_list.append(fname)
    else: # group 2: DII
        adata_list.append(adata)
        slice_name_list.append(fname)
Filtering out sample reg023_A_patient12_group1 due to high proportion of unidentified immune cells (53.36%)
Filtering out sample reg064_A_patient32_group1 due to high proportion of unidentified immune cells (51.93%)
Filtering out sample reg066_A_patient33_group1 due to high proportion of unidentified immune cells (51.50%)
Run model
Instantiate Harmonics
[67]:
model = Harmonics_Model(adata_list,
                        slice_name_list,
                        cond_list=cond_list,
                        cond_name_list=cond_name_list,
                        concat_label='slice_name',  # default
                        proportion_label=None,  # default
                        seed=1234,  # default
                        parallel=True,  # default
                        verbose=True,  # default
                        )
Control set comprises 72 slices, 143062 cells/spots in total.
Condition set comprises 65 slices, 103174 cells/spots in total.
Preprocess the data (Generating the connection graph and calculating neighborhood cell type destribution for cells)
[ ]:
model.preprocess(ct_key='ClusterName',
                 spatial_key='spatial',  # default
                 method='joint',  # default
                 n_step=3,  # default
                 n_neighbors=20,  # default
                 cut_percentage=99,  # default
                 )
Generating Delaunay neighbor graph...
100%|██████████| 137/137 [00:01<00:00, 79.64it/s]
All done!

Performing graph completion...
100%|██████████| 137/137 [00:14<00:00, 9.32it/s]
All done!

The cell types of interest are:
B cells
CD11b+ monocytes
CD11b+CD68+ macrophages
CD11c+ DCs
CD163+ macrophages
CD3+ T cells
CD4+ T cells
CD4+ T cells CD45RO+
CD4+ T cells GATA3+
CD68+ macrophages
CD68+ macrophages GzmB+
CD68+CD163+ macrophages
CD8+ T cells
NK cells
Tregs
adipocytes
granulocytes
immune cells
immune cells / vasculature
lymphatics
nerves
plasma cells
smooth muscle
stroma
tumor cells
tumor cells / immune cells
undefined
vasculature

Generating one-hot matrix...
100%|██████████| 137/137 [00:00<00:00, 515.72it/s]
All done!

Dataset comprises 28 cell types.

Calculating cell type distribution for microenvironments...
Microenvironments comprise 40.36 cells/spots on average.
Minimum: 20, Maximum: 104
Perform overclustered initialization on the cell type distributions of cell neighborhoods for the control group. Resulting in Qmax niches. The distributions of niches are also computed.
[69]:
model.initialize_clusters(dim_reduction=True,  # default
                          explained_var=None,  # default
                          n_components=None,  # default
                          n_components_max=100,  # default
                          standardize=True,  # default
                          method='kmeans',  # default
                          Qmax=20,
                          )
Performing dimension reduction...
Returning 28 principal components.

Initializing niches...
20 initial niches defined.
Perform hierarchical distribution matching for the control group to reduce the niche number to no less than Qmin. This step results in niche assignment under a sequence of different niche numbers (usually from Qmax to Qmin).
[ ]:
model.hier_dist_match(assign_metric='jsd',  # default
                      weighted_merge=True,  # default
                      max_iters=100,  # default
                      tol=1e-4,  # default
                      test_kmeans=False,  # default
                      Qmin=2,  # default
                      )
Starting from 20 cell niches...

Assigning cells to cell niche...
Current state: [0, 1, 2, 3, 4, 5, 6, 7, 8, 9, 10, 11, 12, 13, 14, 15, 16, 17, 18, 19]
52%|█████▏ | 52/100 [00:08<00:07, 6.27it/s]
Distribution of cell niches (centers) converge at iteration 53.
20 cell niches left.
Merging cell niche 2 and cell niche 17...
Done!

Assigning cells to cell niche...
Current state: [0, 1, 2, 3, 4, 5, 6, 7, 8, 9, 10, 11, 12, 13, 14, 15, 16, 18, 19]
9%|▉ | 9/100 [00:01<00:16, 5.66it/s]
Distribution of cell niches (centers) converge at iteration 10.
19 cell niches left.
Merging cell niche 8 and cell niche 11...
Done!

Assigning cells to cell niche...
Current state: [0, 1, 2, 3, 4, 5, 6, 7, 8, 9, 10, 12, 13, 14, 15, 16, 18, 19]
25%|██▌ | 25/100 [00:04<00:12, 6.23it/s]
Distribution of cell niches (centers) converge at iteration 26.
18 cell niches left.
Merging cell niche 3 and cell niche 12...
Done!

Assigning cells to cell niche...
Current state: [0, 1, 2, 3, 4, 5, 6, 7, 8, 9, 10, 13, 14, 15, 16, 18, 19]
31%|███ | 31/100 [00:04<00:10, 6.43it/s]
Distribution of cell niches (centers) converge at iteration 32.
17 cell niches left.
Merging cell niche 3 and cell niche 5...
Done!

Assigning cells to cell niche...
Current state: [0, 1, 2, 3, 4, 6, 7, 8, 9, 10, 13, 14, 15, 16, 18, 19]
24%|██▍ | 24/100 [00:03<00:11, 6.49it/s]
Distribution of cell niches (centers) converge at iteration 25.
16 cell niches left.
Merging cell niche 19 and cell niche 14...
Done!

Assigning cells to cell niche...
Current state: [0, 1, 2, 3, 4, 6, 7, 8, 9, 10, 13, 15, 16, 18, 19]
8%|▊ | 8/100 [00:01<00:16, 5.56it/s]
Distribution of cell niches (centers) converge at iteration 9.
15 cell niches left.
Merging cell niche 8 and cell niche 3...
Done!

Assigning cells to cell niche...
Current state: [0, 1, 2, 4, 6, 7, 8, 9, 10, 13, 15, 16, 18, 19]
15%|█▌ | 15/100 [00:02<00:13, 6.38it/s]
Distribution of cell niches (centers) converge at iteration 16.
14 cell niches left.
Merging cell niche 10 and cell niche 1...
Done!

Assigning cells to cell niche...
Current state: [0, 2, 4, 6, 7, 8, 9, 10, 13, 15, 16, 18, 19]
11%|█ | 11/100 [00:01<00:13, 6.51it/s]
Distribution of cell niches (centers) converge at iteration 12.
13 cell niches left.
Merging cell niche 8 and cell niche 4...
Done!

Assigning cells to cell niche...
Current state: [0, 2, 6, 7, 8, 9, 10, 13, 15, 16, 18, 19]
9%|▉ | 9/100 [00:01<00:13, 6.85it/s]
Distribution of cell niches (centers) converge at iteration 10.
12 cell niches left.
Merging cell niche 6 and cell niche 16...
Done!

Assigning cells to cell niche...
Current state: [0, 2, 6, 7, 8, 9, 10, 13, 15, 18, 19]
7%|▋ | 7/100 [00:01<00:13, 6.90it/s]
Distribution of cell niches (centers) converge at iteration 8.
11 cell niches left.
Merging cell niche 8 and cell niche 13...
Done!

Assigning cells to cell niche...
Current state: [0, 2, 6, 7, 8, 9, 10, 15, 18, 19]
84%|████████▍ | 84/100 [00:10<00:02, 7.73it/s]
Distribution of cell niches (centers) converge at iteration 85.
10 cell niches left.
Merging cell niche 19 and cell niche 8...
Done!

Assigning cells to cell niche...
Current state: [0, 2, 6, 7, 9, 10, 15, 18, 19]
20%|██ | 20/100 [00:02<00:10, 7.52it/s]
Distribution of cell niches (centers) converge at iteration 21.
9 cell niches left.
Merging cell niche 18 and cell niche 10...
Done!

Assigning cells to cell niche...
Current state: [0, 2, 6, 7, 9, 15, 18, 19]
11%|█ | 11/100 [00:01<00:12, 7.00it/s]
Distribution of cell niches (centers) converge at iteration 12.
8 cell niches left.
Merging cell niche 6 and cell niche 0...
Done!

Assigning cells to cell niche...
Current state: [2, 6, 7, 9, 15, 18, 19]
11%|█ | 11/100 [00:01<00:11, 7.42it/s]
Distribution of cell niches (centers) converge at iteration 12.
7 cell niches left.
Merging cell niche 6 and cell niche 15...
Done!

Assigning cells to cell niche...
Current state: [2, 6, 7, 9, 18, 19]
10%|█ | 10/100 [00:01<00:11, 7.87it/s]
Distribution of cell niches (centers) converge at iteration 11.
6 cell niches left.
Merging cell niche 2 and cell niche 7...
Done!

Assigning cells to cell niche...
Current state: [2, 6, 9, 18, 19]
4%|▍ | 4/100 [00:00<00:12, 7.71it/s]
Distribution of cell niches (centers) converge at iteration 5.
5 cell niches left.
Merging cell niche 18 and cell niche 19...
Done!

Assigning cells to cell niche...
Current state: [2, 6, 9, 18]
13%|█▎ | 13/100 [00:01<00:09, 9.02it/s]
Distribution of cell niches (centers) converge at iteration 14.
4 cell niches left.
Merging cell niche 18 and cell niche 9...
Done!

Assigning cells to cell niche...
Current state: [2, 6, 18]
8%|▊ | 8/100 [00:00<00:10, 8.95it/s]
Distribution of cell niches (centers) converge at iteration 9.
3 cell niches left.
Merging cell niche 6 and cell niche 18...
Done!

Assigning cells to cell niche...
Current state: [2, 6]
8%|▊ | 8/100 [00:00<00:09, 9.29it/s]
Distribution of cell niches (centers) converge at iteration 9.
2 cell niches left.
Niche count no more than 2.

Finished!
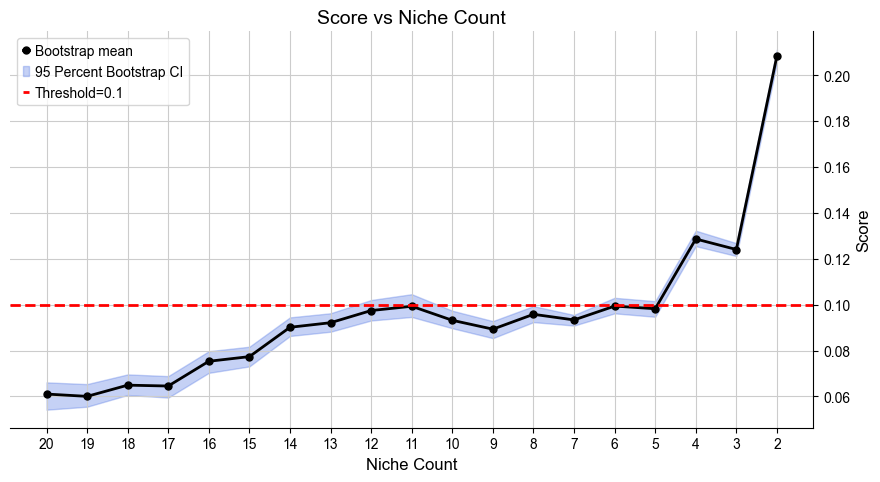
Automatically define the most appropriate number of basic cell niches based on minJSD score for the control group. The results are saved in .obs[niche_key]
[71]:
adata_list, adata_concat = model.select_solution(n_niche=None,  # default
                                                 niche_key='niche_label',  # default
                                                 auto=True,  # default
                                                 metric='jsd_v2',  # default
                                                 threshold=0.1,  # default
                                                 return_adata=True,  # default
                                                 plot=True,  # default
                                                 save=False,  # default
                                                 fig_size=(9, 5),  # default
                                                 save_dir=save_dir,
                                                 file_name=f'score_vs_nichecount_basic.pdf',
                                                 )
Automatically selecting best solution...
100%|██████████| 100/100 [00:00<00:00, 152.73it/s]
100%|██████████| 100/100 [00:00<00:00, 154.69it/s]
100%|██████████| 100/100 [00:00<00:00, 160.37it/s]
100%|██████████| 100/100 [00:00<00:00, 163.52it/s]
100%|██████████| 100/100 [00:00<00:00, 171.47it/s]
100%|██████████| 100/100 [00:00<00:00, 173.69it/s]
100%|██████████| 100/100 [00:00<00:00, 174.17it/s]
100%|██████████| 100/100 [00:00<00:00, 178.67it/s]
100%|██████████| 100/100 [00:00<00:00, 171.18it/s]
100%|██████████| 100/100 [00:00<00:00, 175.41it/s]
100%|██████████| 100/100 [00:00<00:00, 169.87it/s]
100%|██████████| 100/100 [00:00<00:00, 168.65it/s]
100%|██████████| 100/100 [00:00<00:00, 191.93it/s]
100%|██████████| 100/100 [00:00<00:00, 227.14it/s]
100%|██████████| 100/100 [00:00<00:00, 220.98it/s]
100%|██████████| 100/100 [00:00<00:00, 245.33it/s]
100%|██████████| 100/100 [00:00<00:00, 259.52it/s]
100%|██████████| 100/100 [00:00<00:00, 252.52it/s]
100%|██████████| 100/100 [00:00<00:00, 266.44it/s]
Suggested range of niche count is from 4 to 12.
Recommended number of niches are [4]
Selecting 4 niches as the best solution.
Done!
Perform overclustered initialization on the cell type distributions of cell neighborhoods for the case group. Resulting in Rmax new niches. The distributions of new niches are also computed.
[72]:
model.initialize_clusters_cond(assign_metric='jsd',  # default
                               threshold=0.1,  # default
                               min_cell_per_niche=100,  # default
                               dim_reduction=True,  # default
                               explained_var=None,  # default
                               n_components=None,  # default
                               n_components_max=100,  # default
                               standardize=True,  # default
                               method='kmeans',  # default
                               Rmax=10,  # default
                               )
Assigning cells to fixed niches...
13345 out of 103174 cells are assigned to fixed niches.

Performing dimension reduction...
Returning 28 principal components.

Initializing niches...
10 new niches defined.
Perform hierarchical distribution matching for the case group to reduce the niche number to 0. This step results in niche assignment under a sequence of different niche numbers (usually from Rmax to 0).
[73]:
model.hier_dist_match_cond(assign_metric='jsd',  # default
                           weighted_merge=True,  # default
                           max_iters=100,  # default
                           tol=1e-4,  # default
                           )
Starting from 10 new cell niches...

Assigning cells to cell niche...
Current state: [0, 1, 2, 3, 4, 5, 6, 7, 8, 9, 10, 11, 12, 13]
31%|███ | 31/100 [00:03<00:08, 8.45it/s]
Distribution of cell niches (centers) converge at iteration 32.
10 new cell niches left.
Merging new cell niche 4 into basic cell niche 3...
Done!

Assigning cells to cell niche...
Current state: [0, 1, 2, 3, 5, 6, 7, 8, 9, 10, 11, 12, 13]
10%|█ | 10/100 [00:01<00:10, 8.50it/s]
Distribution of cell niches (centers) converge at iteration 11.
9 new cell niches left.
Merging new cell niche 5 into basic cell niche 0...
Done!

Assigning cells to cell niche...
Current state: [0, 1, 2, 3, 6, 7, 8, 9, 10, 11, 12, 13]
5%|▌ | 5/100 [00:00<00:10, 8.90it/s]
Distribution of cell niches (centers) converge at iteration 6.
8 new cell niches left.
Merging new cell niche 10 into basic cell niche 1...
Done!

Assigning cells to cell niche...
Current state: [0, 1, 2, 3, 6, 7, 8, 9, 11, 12, 13]
7%|▋ | 7/100 [00:00<00:09, 10.00it/s]
Distribution of cell niches (centers) converge at iteration 8.
7 new cell niches left.
Merging new cell niche 11 into basic cell niche 3...
Done!

Assigning cells to cell niche...
Current state: [0, 1, 2, 3, 6, 7, 8, 9, 12, 13]
17%|█▋ | 17/100 [00:01<00:07, 11.06it/s]
Distribution of cell niches (centers) converge at iteration 18.
6 new cell niches left.
Merging new cell niche 7 into basic cell niche 3...
Done!

Assigning cells to cell niche...
Current state: [0, 1, 2, 3, 6, 8, 9, 12, 13]
27%|██▋ | 27/100 [00:02<00:06, 11.17it/s]
Distribution of cell niches (centers) converge at iteration 28.
5 new cell niches left.
Merging new cell niche 12 into basic cell niche 3...
Done!

Assigning cells to cell niche...
Current state: [0, 1, 2, 3, 6, 8, 9, 13]
35%|███▌ | 35/100 [00:02<00:05, 12.38it/s]
Distribution of cell niches (centers) converge at iteration 36.
4 new cell niches left.
Merging new cell niche 8 into basic cell niche 3...
Done!

Assigning cells to cell niche...
Current state: [0, 1, 2, 3, 6, 9, 13]
26%|██▌ | 26/100 [00:02<00:05, 12.93it/s]
Distribution of cell niches (centers) converge at iteration 27.
3 new cell niches left.
Merging new cell niche 6 into basic cell niche 3...
Done!

Assigning cells to cell niche...
Current state: [0, 1, 2, 3, 9, 13]
1%| | 1/100 [00:00<00:11, 8.37it/s]
Distribution of cell niches (centers) converge at iteration 2.
2 new cell niches left.
Merging new cell niche 13 and new cell niche 9...
Done!

Assigning cells to cell niche...
Current state: [0, 1, 2, 3, 13]
3%|▎ | 3/100 [00:00<00:07, 12.96it/s]
Distribution of cell niches (centers) converge at iteration 4.
1 new cell niches left.
Merging new cell niche 13 into basic cell niche 3...
Done!

Assigning cells to cell niche...
Current state: [0, 1, 2, 3]
No new cell niche, all cells assigned to basic niches.
0 new cell niches left.
No new cell niche left.

Finished!
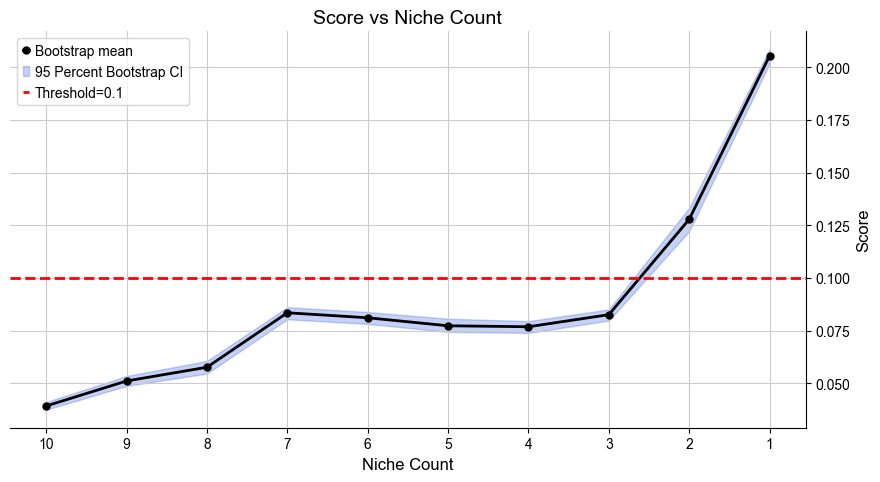
Automatically define the most appropriate number of condition-specific niches based on minJSD score for the case group. The results of niche assignments are saved in .obs[niche_key] and .obs[csn_label]. All basic cell niches are named “basic” in .obs[csn_label] and condition-specific niches start with a prefix “R”.
[74]:
cond_list, cond_concat = model.select_solution_cond(n_csn=None,  # default
                                                    niche_key='niche_label',  # default
                                                    csn_key='csn_label',  # default
                                                    auto=True,  # default
                                                    metric='jsd_v2',  # default
                                                    threshold=0.1,  # default
                                                    return_adata=True,  # default
                                                    plot=True,  # default
                                                    save=False,  # default
                                                    fig_size=(9, 5),  # default
                                                    save_dir=save_dir,
                                                    file_name='score_vs_nichecount_cond.pdf',
                                                    )
Automatically selecting best solution...
100%|██████████| 100/100 [00:00<00:00, 255.12it/s]
100%|██████████| 100/100 [00:00<00:00, 310.97it/s]
100%|██████████| 100/100 [00:00<00:00, 343.89it/s]
100%|██████████| 100/100 [00:00<00:00, 399.21it/s]
100%|██████████| 100/100 [00:00<00:00, 452.14it/s]
100%|██████████| 100/100 [00:00<00:00, 484.17it/s]
100%|██████████| 100/100 [00:00<00:00, 581.14it/s]
100%|██████████| 100/100 [00:00<00:00, 694.84it/s]
100%|██████████| 100/100 [00:00<00:00, 1026.94it/s]
100%|██████████| 100/100 [00:00<00:00, 1428.61it/s]
Suggested range of condition specific niche count is from 2 to 2.
Recommended number of condition specific niches are [2]
Selecting 2 new niches as the best solution.
Done!
Save and reload the results
[ ]:
adata_concat.write_h5ad(save_dir + 'Harmonics_basic_result_0.h5ad')
cond_concat.write_h5ad(save_dir + 'Harmonics_cond_result_0.h5ad')
[8]:
adata_concat = ad.read_h5ad(save_dir + 'Harmonics_basic_result_0.h5ad')
cond_concat = ad.read_h5ad(save_dir + 'Harmonics_cond_result_0.h5ad')

for i, slice_name in enumerate(slice_name_list):
    adata = adata_concat[adata_concat.obs['slice_name'] == slice_name, :].copy()
    adata_list[i] = adata
for i, slice_name in enumerate(cond_name_list):
    adata = cond_concat[cond_concat.obs['slice_name'] == slice_name, :].copy()
    cond_list[i] = adata
[9]:
adata_concat_new = adata_concat.copy()
cond_concat_new = cond_concat.copy()
adata_concat_new, cond_concat_new
[9]:
(AnnData object with n_obs × n_vars = 143062 × 56
     obs: 'CellID', 'ClusterID', 'EventID', 'File Name', 'Region', 'TMA_AB', 'TMA_12', 'Index in File', 'groups', 'patients', 'spots', 'cell_id:cell_id', 'tile_nr:tile_nr', 'X:X', 'Y:Y', 'X_withinTile:X_withinTile', 'Y_withinTile:Y_withinTile', 'Z:Z', 'size:size', 'HOECHST1:Cyc_1_ch_1', 'DRAQ5:Cyc_23_ch_4', 'Profile_Homogeneity:Fiter1', 'ClusterSize', 'ClusterName', 'neighborhood10', 'CD4+ICOS+', 'CD4+Ki67+', 'CD4+PD-1+', 'CD68+CD163+ICOS+', 'CD68+CD163+Ki67+', 'CD68+CD163+PD-1+', 'CD68+ICOS+', 'CD68+Ki67+', 'CD68+PD-1+', 'CD8+ICOS+', 'CD8+Ki67+', 'CD8+PD-1+', 'Treg-ICOS+', 'Treg-Ki67+', 'Treg-PD-1+', 'neighborhood number final', 'neighborhood name', 'slice_name', 'celltype_idx', 'n_neighbors', 'niche_label_20', 'niche_label_19', 'niche_label_18', 'niche_label_17', 'niche_label_16', 'niche_label_15', 'niche_label_14', 'niche_label_13', 'niche_label_12', 'niche_label_11', 'niche_label_10', 'niche_label_9', 'niche_label_8', 'niche_label_7', 'niche_label_6', 'niche_label_5', 'niche_label_4', 'niche_label_3', 'niche_label_2', 'niche_label_jsd_v2', 'niche_label_jsd', 'niche_label_fmi', 'niche_label_ari', 'niche_label_nmi', 'niche_label_asw', 'niche_label_js_asw', 'niche_label_fisher', 'niche_label_chi', 'niche_label_dbi', 'niche_label_dass_mean', 'niche_label_dass_min', 'niche_label_dafisher', 'niche_label_dachi', 'niche_label_0.09', 'niche_label_0.11', 'niche_label'
     uns: 'ct2idx', 'idx2ct', 'niche_cell_count', 'niche_dist', 'niche_label_summary', 'score_dict'
     obsm: 'micro_dist', 'onehot', 'spatial',
 AnnData object with n_obs × n_vars = 103174 × 56
     obs: 'CellID', 'ClusterID', 'EventID', 'File Name', 'Region', 'TMA_AB', 'TMA_12', 'Index in File', 'groups', 'patients', 'spots', 'cell_id:cell_id', 'tile_nr:tile_nr', 'X:X', 'Y:Y', 'X_withinTile:X_withinTile', 'Y_withinTile:Y_withinTile', 'Z:Z', 'size:size', 'HOECHST1:Cyc_1_ch_1', 'DRAQ5:Cyc_23_ch_4', 'Profile_Homogeneity:Fiter1', 'ClusterSize', 'ClusterName', 'neighborhood10', 'CD4+ICOS+', 'CD4+Ki67+', 'CD4+PD-1+', 'CD68+CD163+ICOS+', 'CD68+CD163+Ki67+', 'CD68+CD163+PD-1+', 'CD68+ICOS+', 'CD68+Ki67+', 'CD68+PD-1+', 'CD8+ICOS+', 'CD8+Ki67+', 'CD8+PD-1+', 'Treg-ICOS+', 'Treg-Ki67+', 'Treg-PD-1+', 'neighborhood number final', 'neighborhood name', 'slice_name', 'celltype_idx', 'n_neighbors', 'niche_label_10', 'csn_label_10', 'niche_label_9', 'csn_label_9', 'niche_label_8', 'csn_label_8', 'niche_label_7', 'csn_label_7', 'niche_label_6', 'csn_label_6', 'niche_label_5', 'csn_label_5', 'niche_label_4', 'csn_label_4', 'niche_label_3', 'csn_label_3', 'niche_label_2', 'csn_label_2', 'niche_label_1', 'csn_label_1', 'niche_label_0', 'csn_label_0', 'niche_label_jsd_v2', 'csn_label_jsd_v2', 'niche_label_jsd', 'csn_label_jsd', 'niche_label_fmi', 'csn_label_fmi', 'niche_label_ari', 'csn_label_ari', 'niche_label_nmi', 'csn_label_nmi', 'niche_label_asw', 'csn_label_asw', 'niche_label_js_asw', 'csn_label_js_asw', 'niche_label_fisher', 'csn_label_fisher', 'niche_label_chi', 'csn_label_chi', 'niche_label_dbi', 'csn_label_dbi', 'niche_label_dass_mean', 'csn_label_dass_mean', 'niche_label_dass_min', 'csn_label_dass_min', 'niche_label_dafisher', 'csn_label_dafisher', 'niche_label_dachi', 'csn_label_dachi', 'niche_label_0.09', 'csn_label_0.09', 'niche_label_0.11', 'csn_label_0.11', 'niche_label', 'csn_label'
     uns: 'ct2idx', 'idx2ct', 'niche_cell_count', 'niche_dist', 'niche_label_summary', 'score_dict'
     obsm: 'micro_dist', 'onehot', 'spatial')
Plot the results
[10]:
n_niches = np.max(np.asarray(cond_concat_new.uns['niche_label_summary'], dtype=int)) + 1
niche_colors = ['#1f77b4', '#ff7f0e', '#279e68', '#d62728', '#b5bd61', '#e377c2',
                # '#17becf', '#e6afb9',  '#aaf3ff', '#d33f6a', '#11c638', '#336600',"#ffe119",'#8e063b', '#4a6fe3', '#d5eae7',
                ]
niche_color_dict = {str(k): niche_colors[k] for k in range(n_niches)}

n_basic_niches = len(adata_concat_new.uns['niche_label_summary'])
n_csn = n_niches - n_basic_niches
csns = [f'R{label}' for label in range(n_csn)]
csn_color_dict = {csns[k]: niche_colors[k+n_basic_niches] for k in range(n_csn)}
csn_color_dict['basic'] = '#d3d3d3'

celltypes = ['B cells', 'CD11b+ monocytes', 'CD11b+CD68+ macrophages', 'CD11c+ DCs', 'CD163+ macrophages', 'CD3+ T cells', 'CD4+ T cells',
             'CD4+ T cells CD45RO+', 'CD4+ T cells GATA3+', 'CD68+ macrophages', 'CD68+ macrophages GzmB+', 'CD68+CD163+ macrophages',
             'CD8+ T cells', 'NK cells', 'Tregs', 'adipocytes', 'granulocytes', 'immune cells', 'immune cells / vasculature', 'lymphatics',
             'nerves', 'plasma cells', 'smooth muscle', 'stroma', 'tumor cells', 'tumor cells / immune cells', 'vasculature', 'undefined']
ct_colors = ["#ffe119", '#7d87b9', '#bec1d4', '#d6bcc0', '#bb7784', '#8e063b', '#4a6fe3',
             '#8595e1', '#b5bbe3', '#e6afb9', '#e07b91', '#d33f6a',
             '#11c638', '#8dd593', '#c6dec7', '#ead3c6', '#f0b98d', '#ef9708', '#0fcfc0', '#9cded6',
             '#d5eae7', '#f3e1eb', '#f6c4e1', '#f79cd4', '#1ce6ff', '#aaf3ff', '#336600', '#d3d3d3']
ct_color_dict = {ct: color for ct, color in zip(celltypes, ct_colors)}
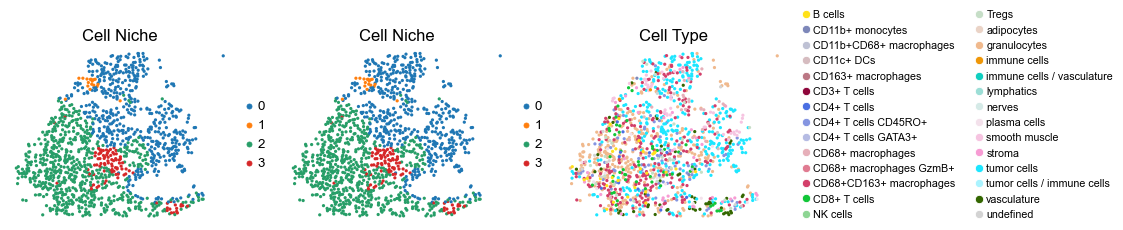
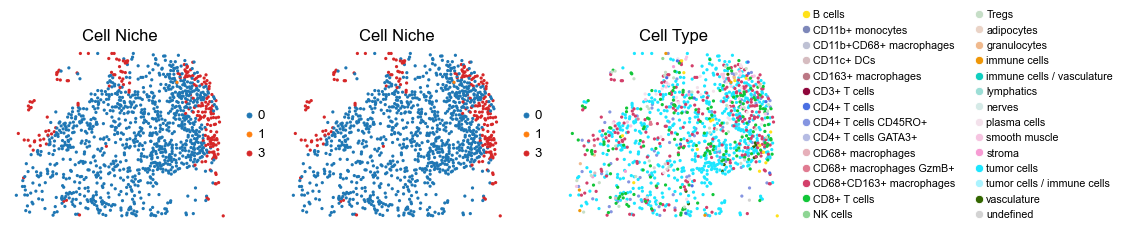
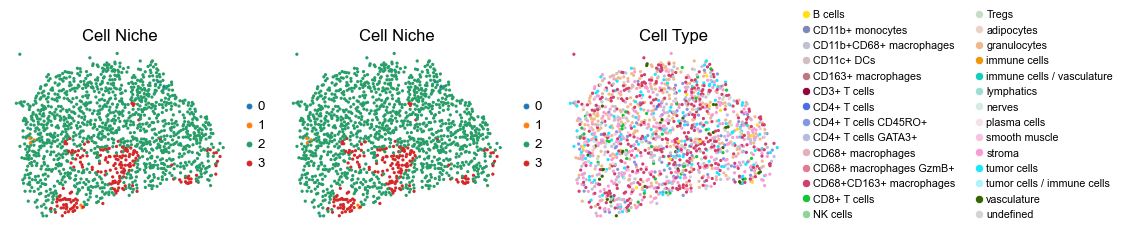
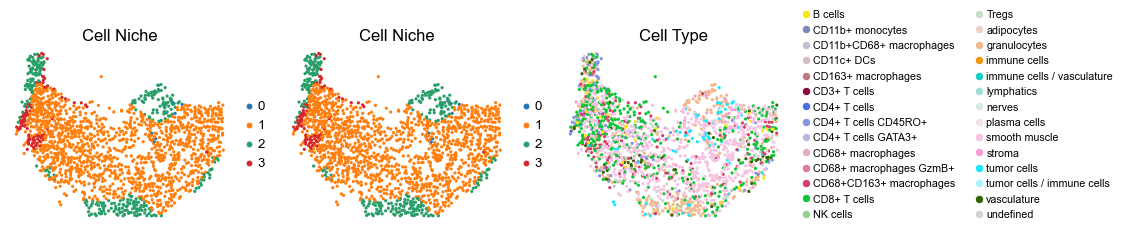
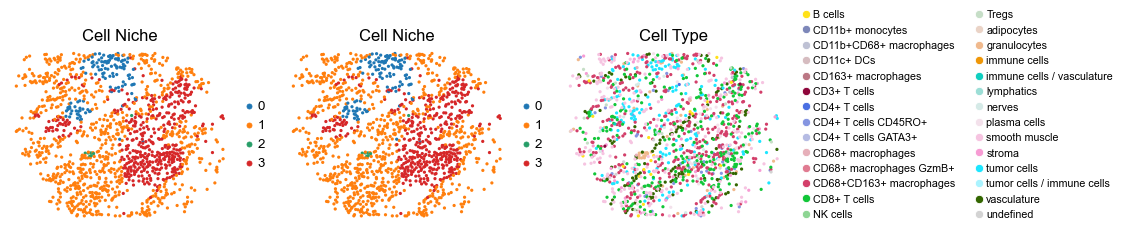
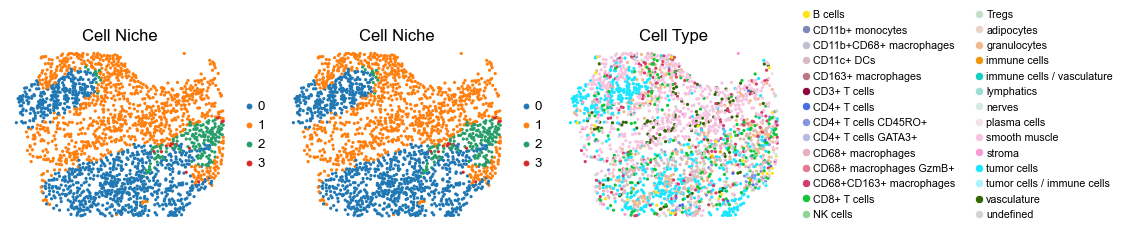
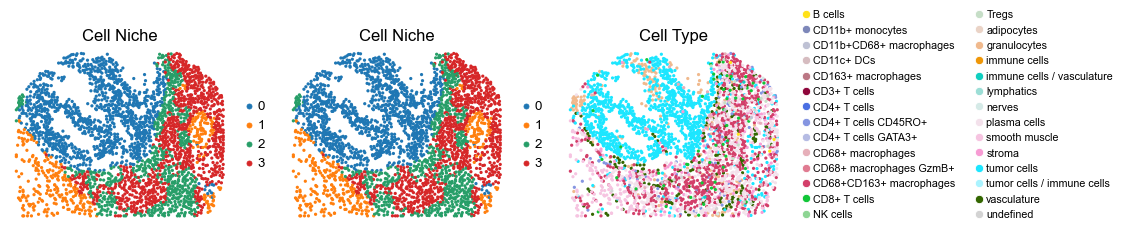
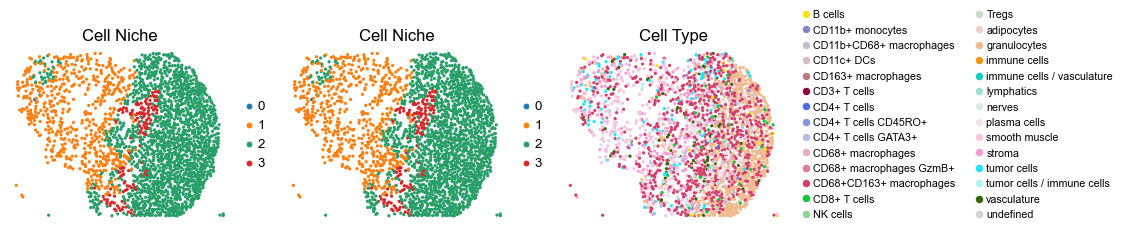
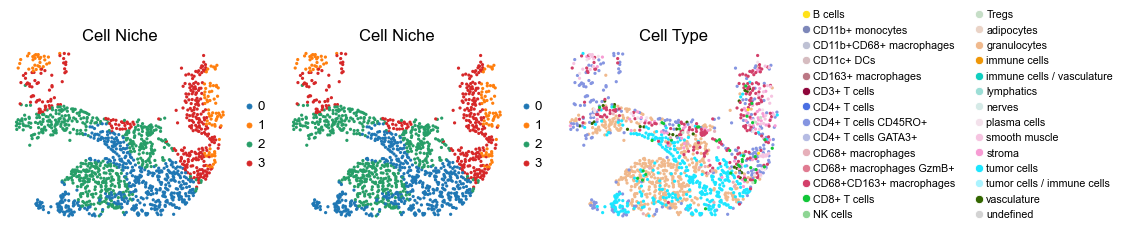
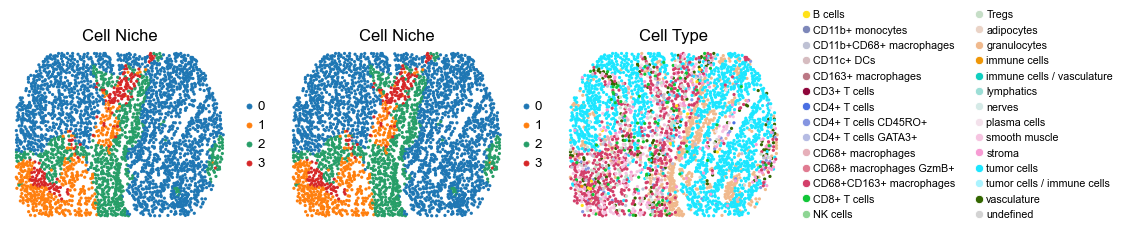
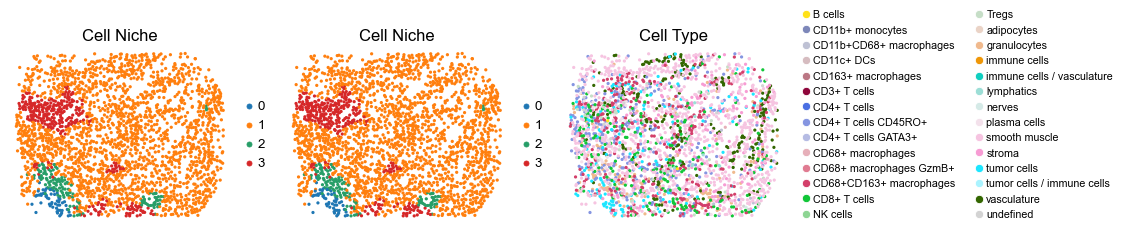
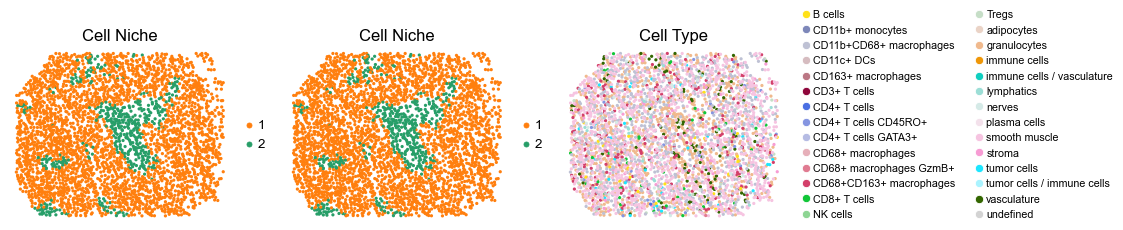
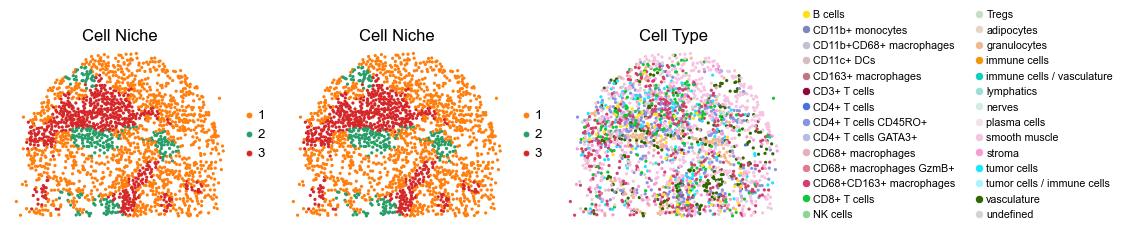
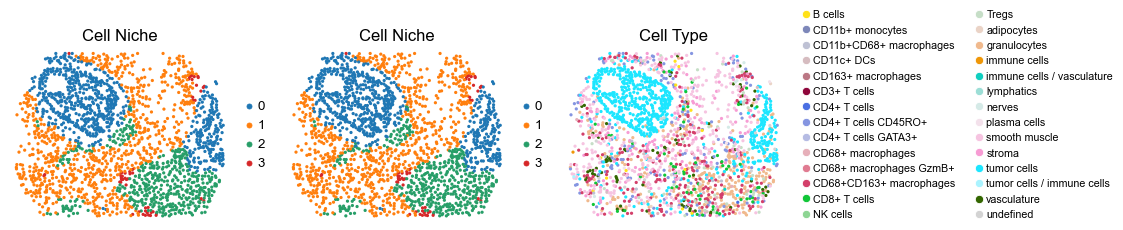
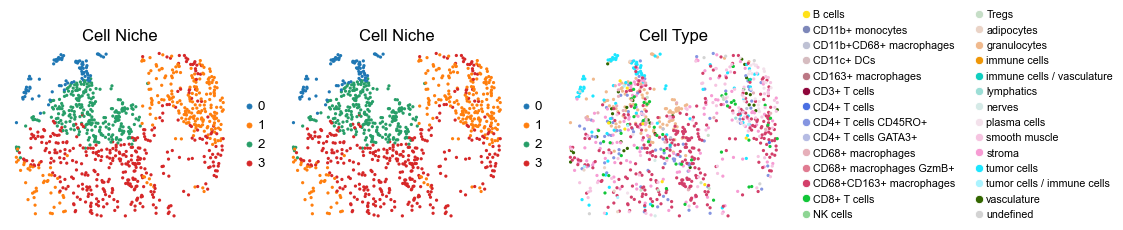
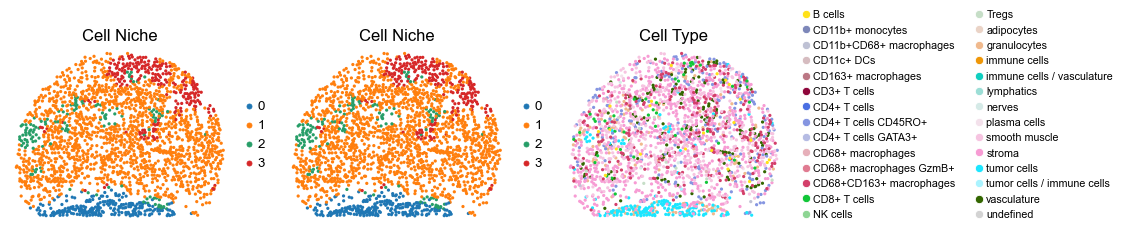
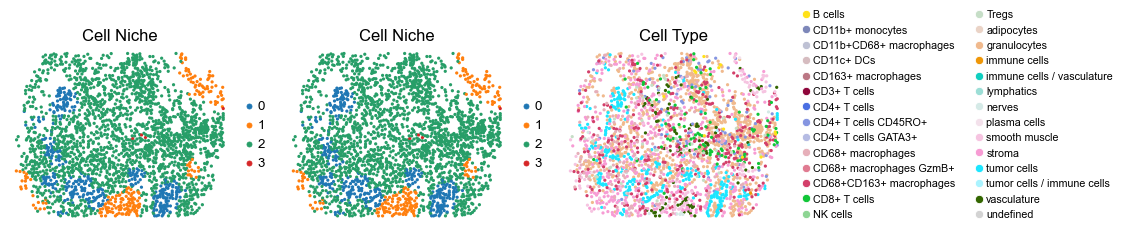
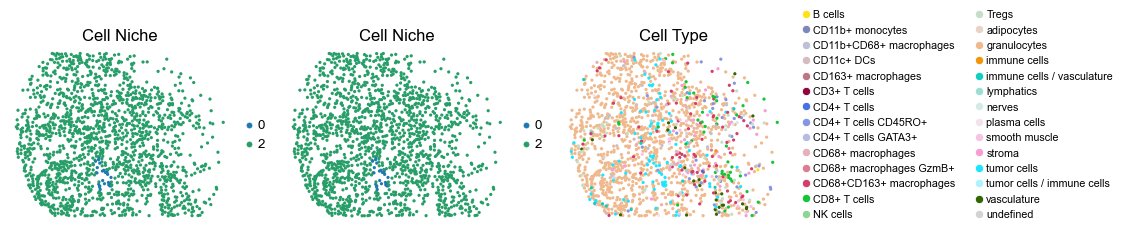
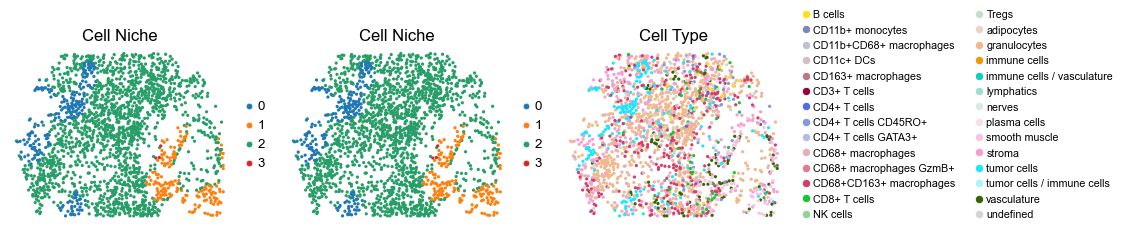
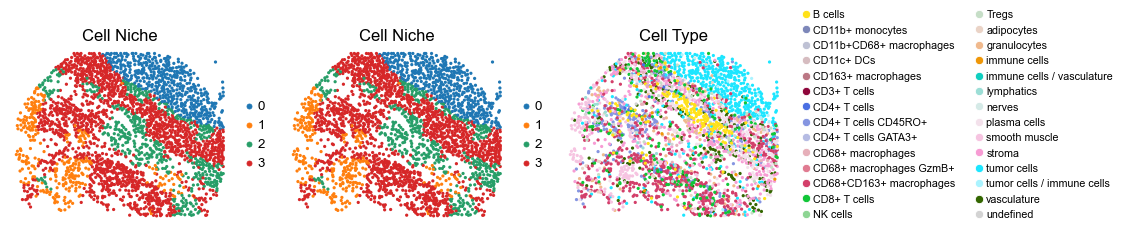
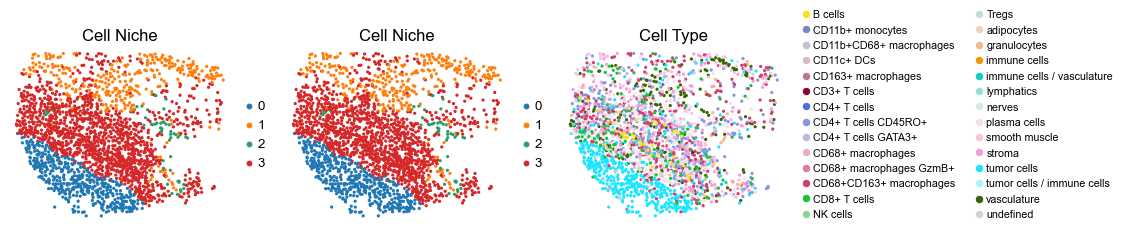
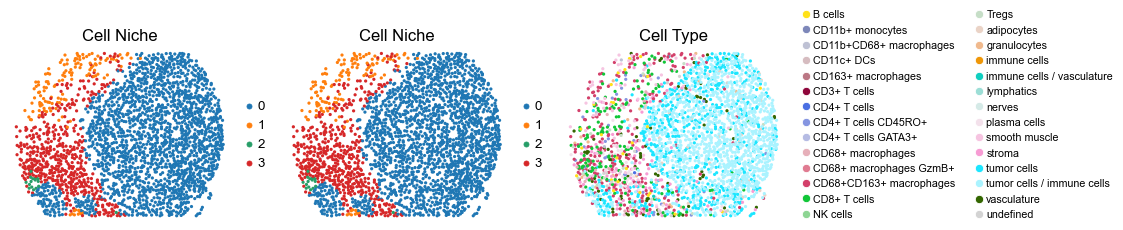
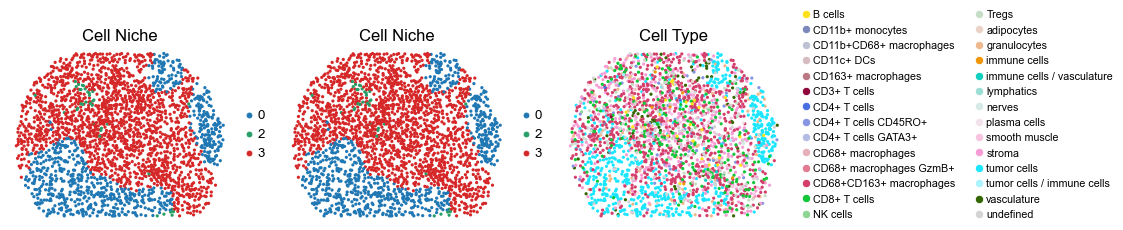
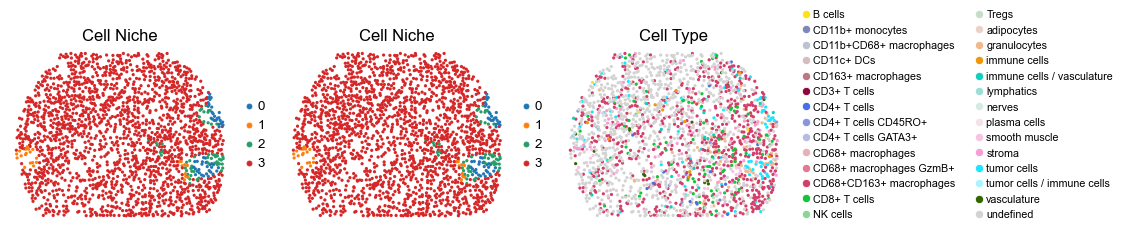
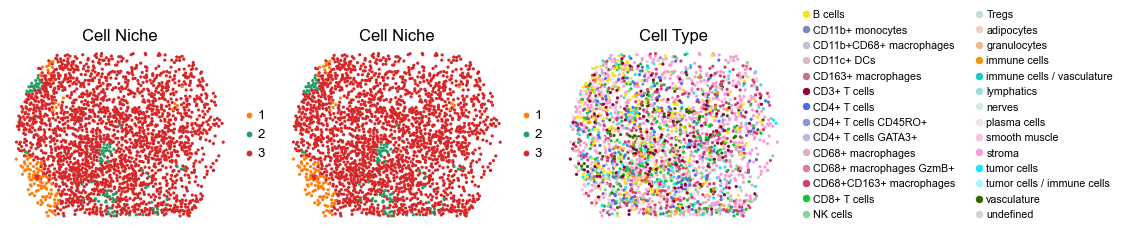
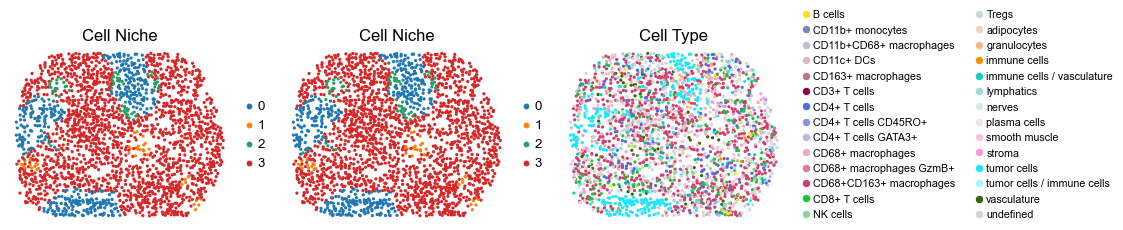
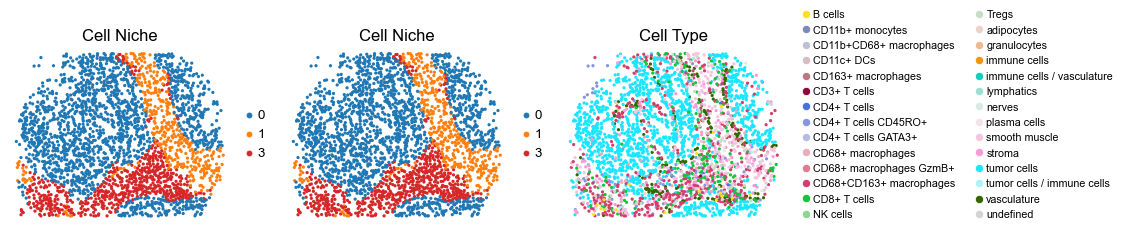
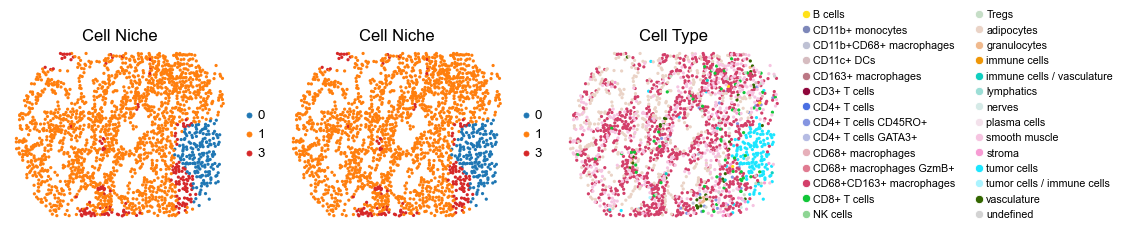
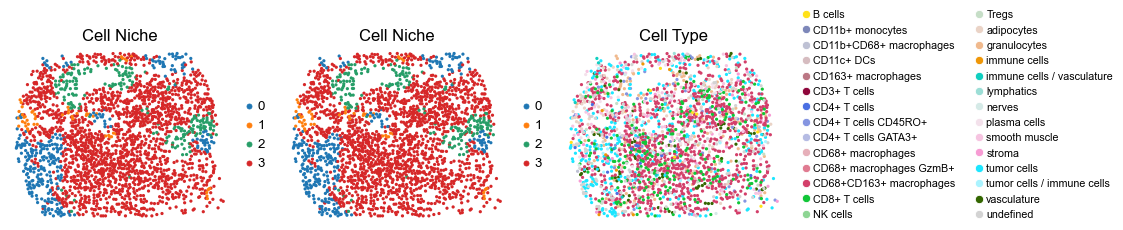
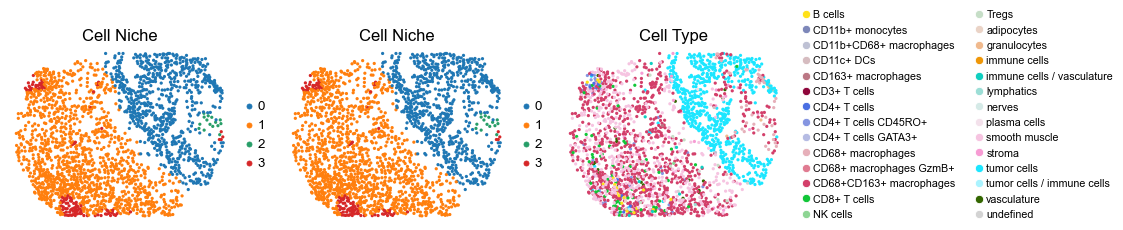
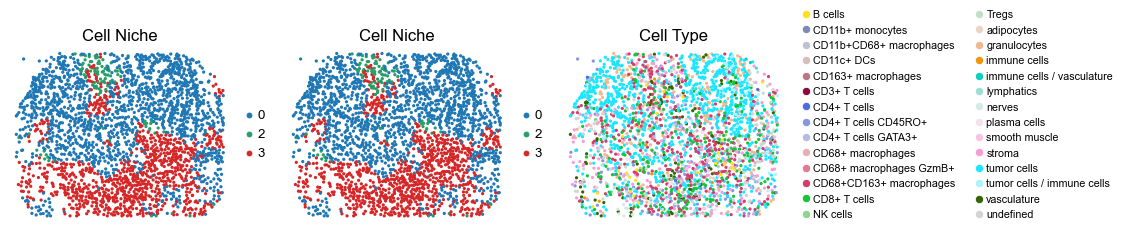
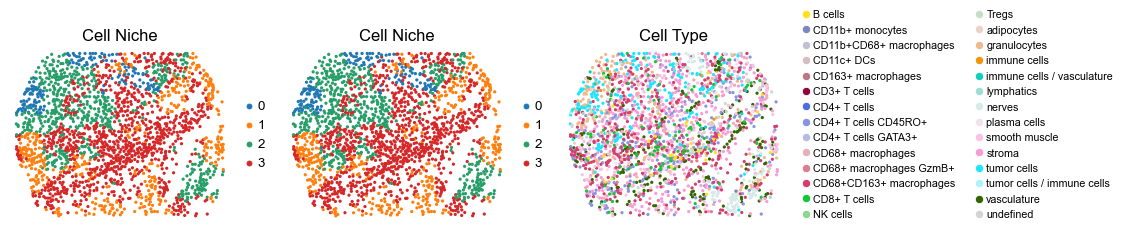
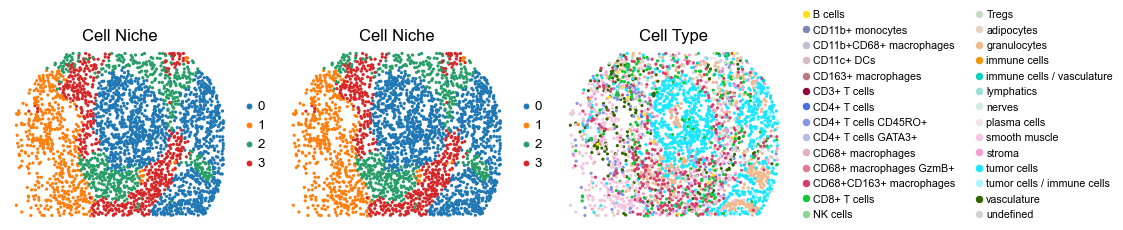
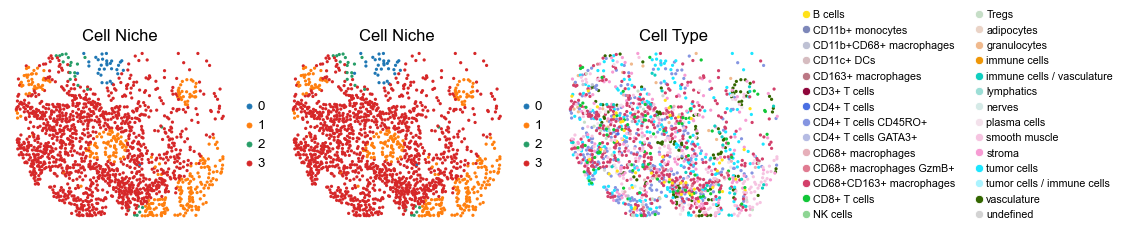
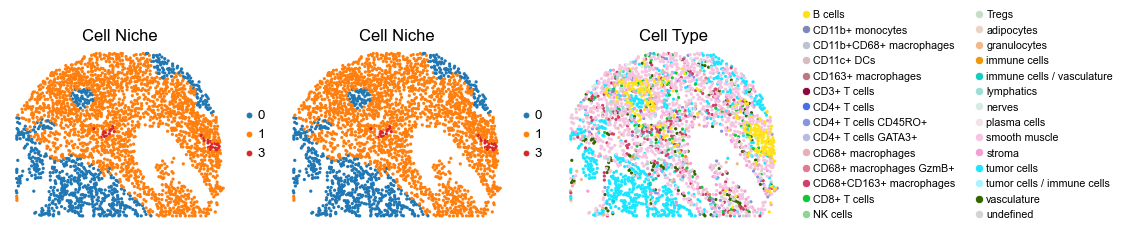
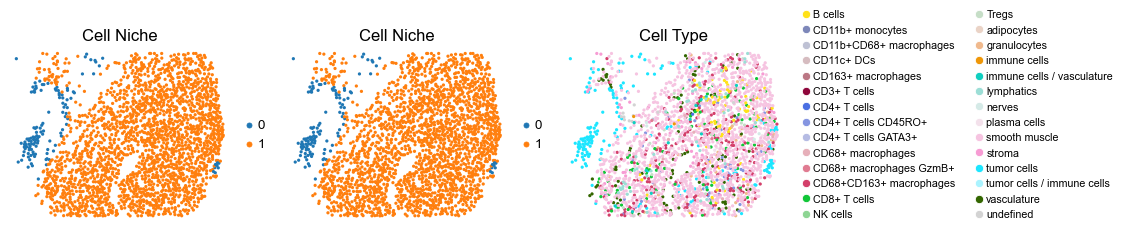
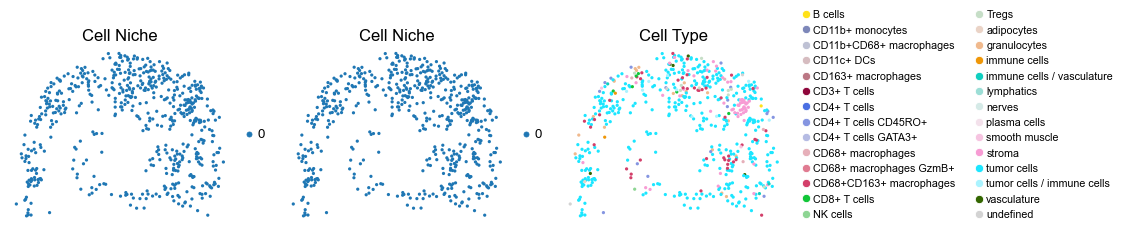
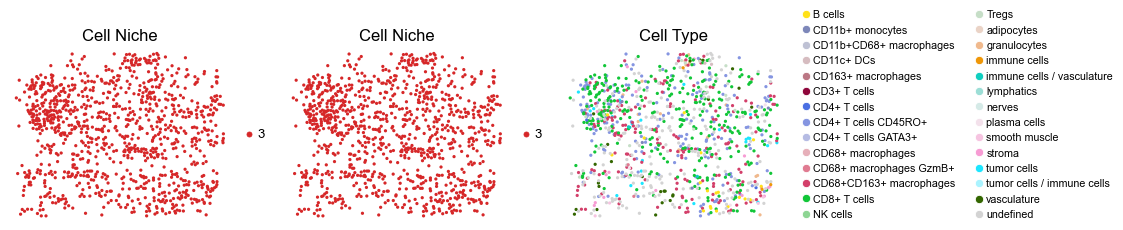
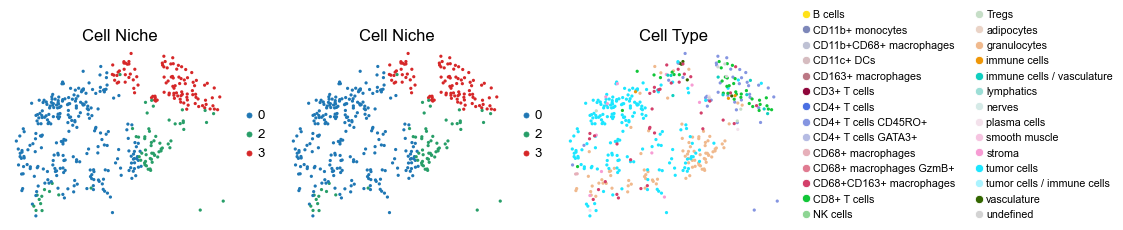
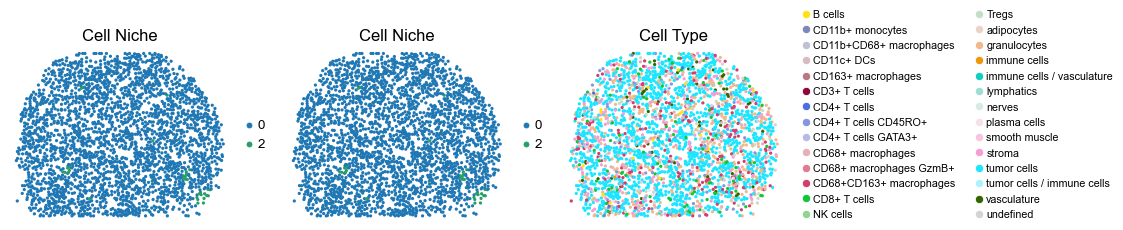
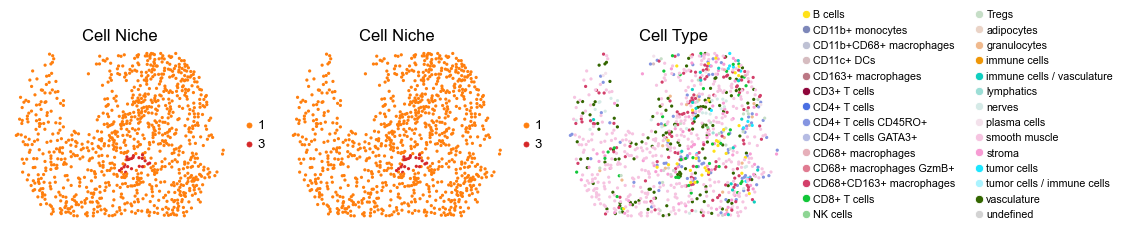
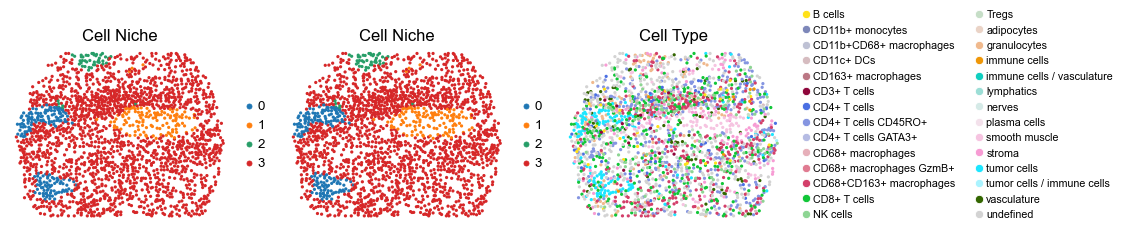
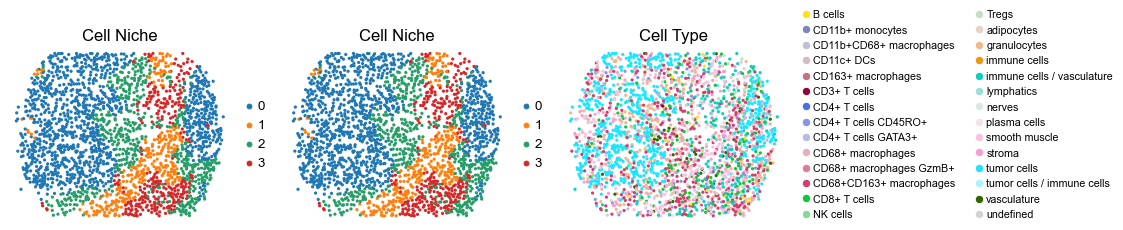
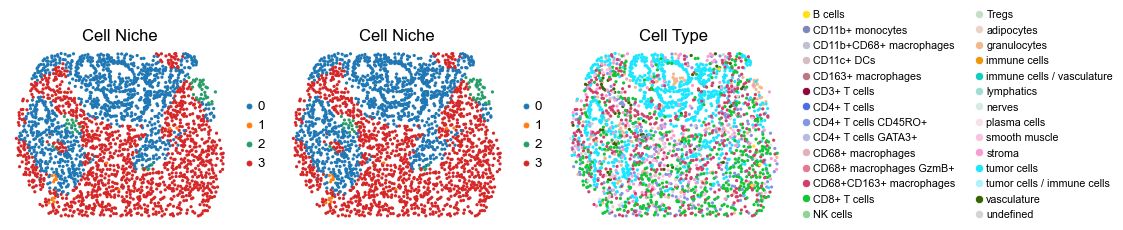
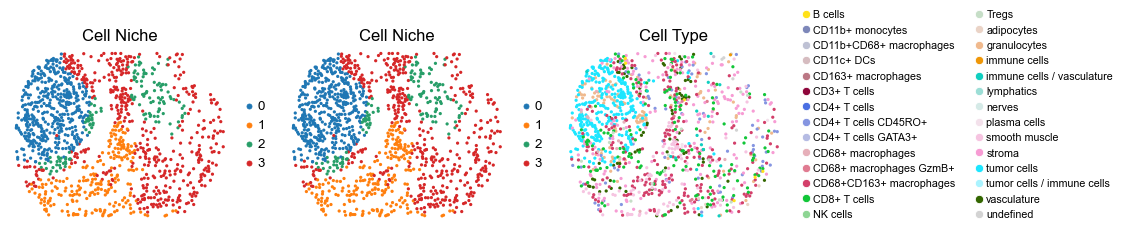
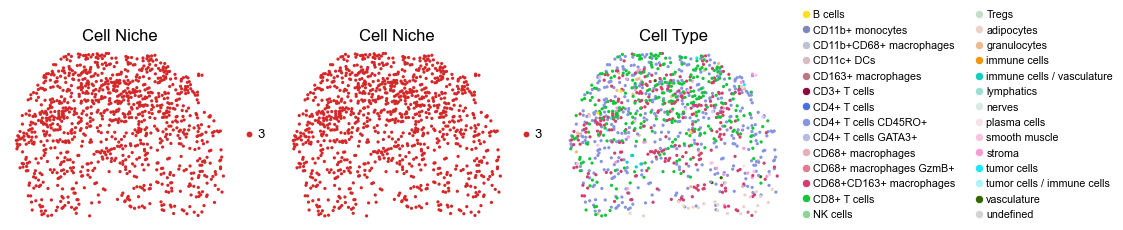
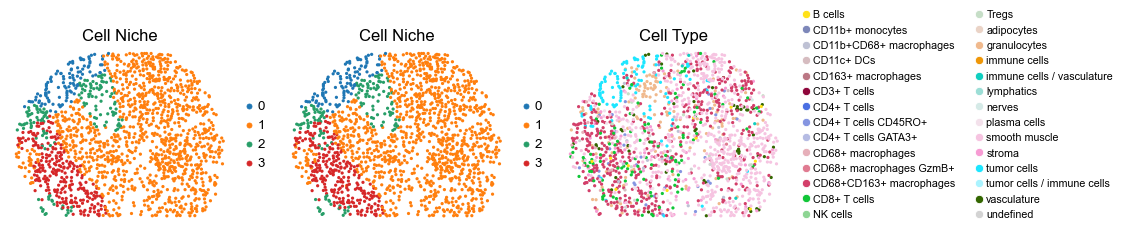
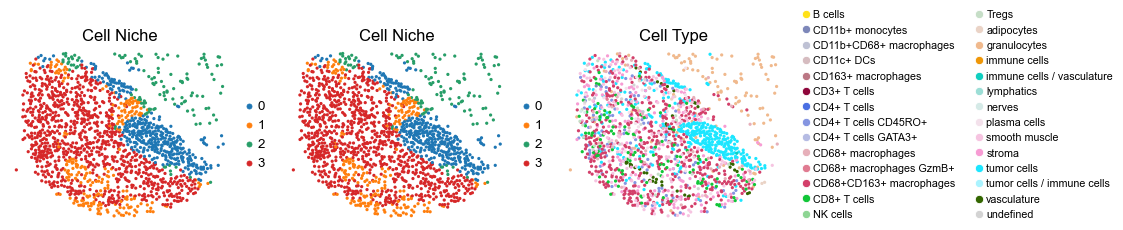
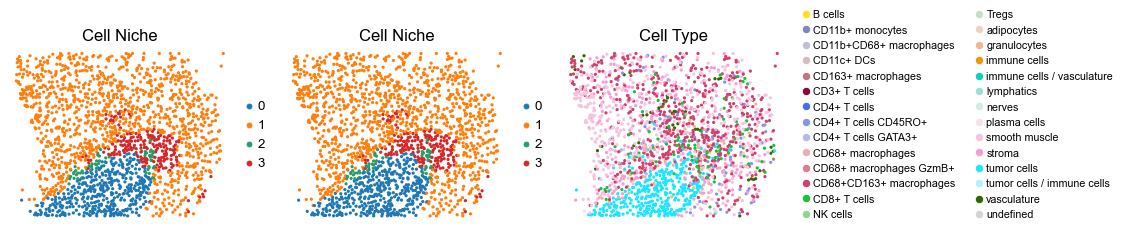
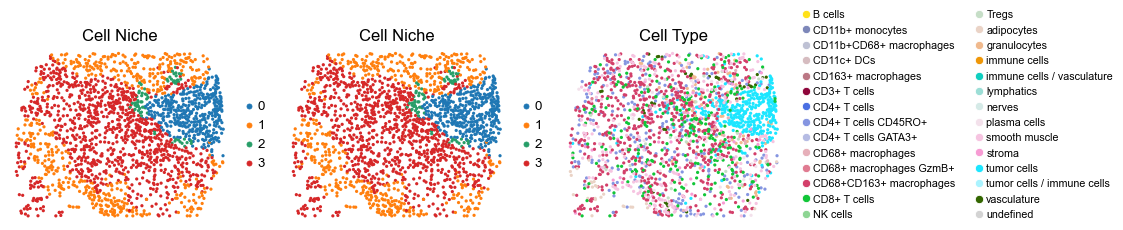
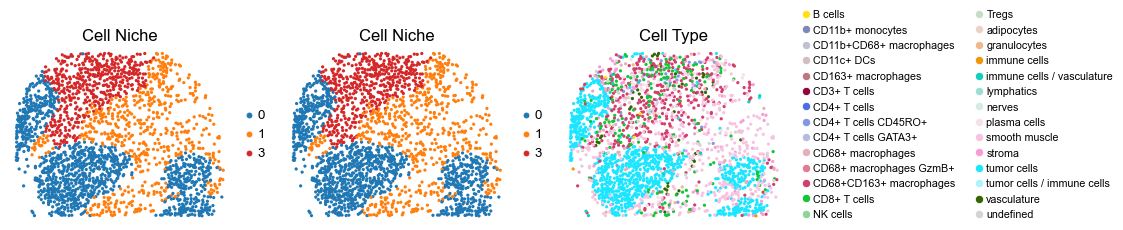
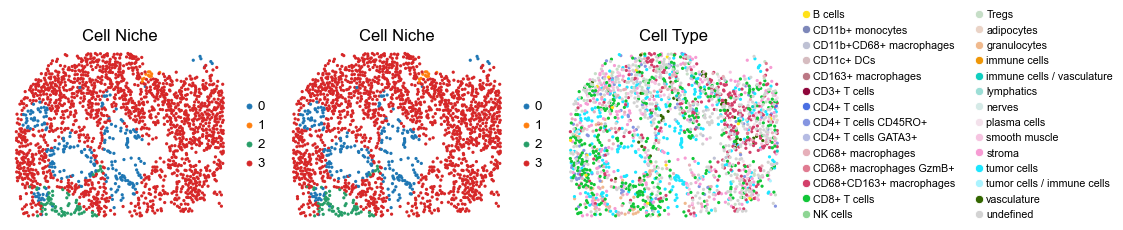
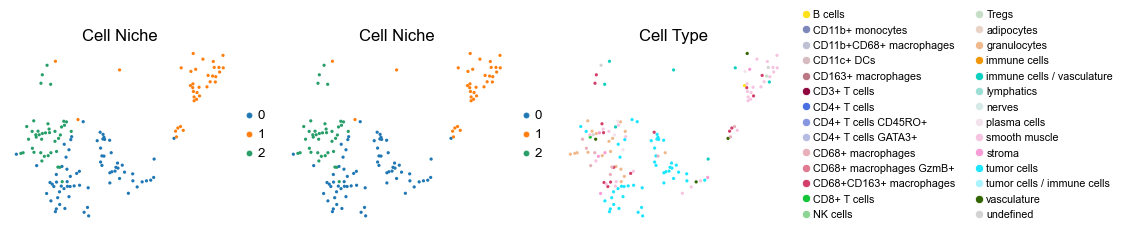
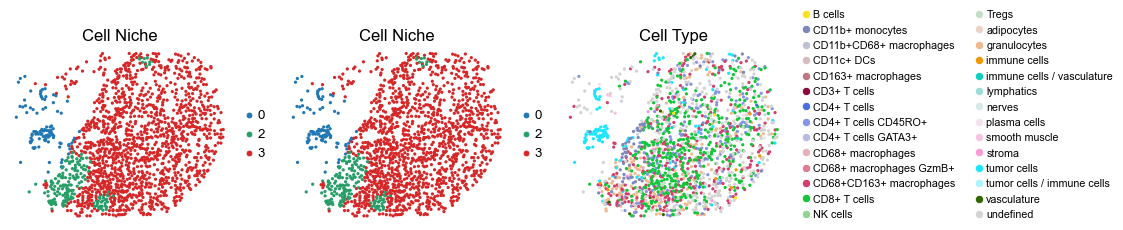
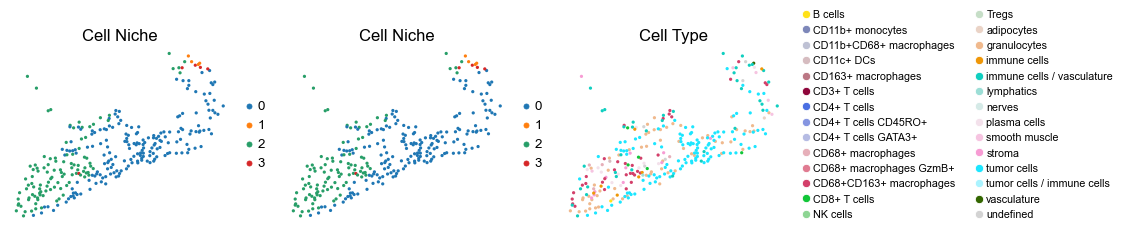
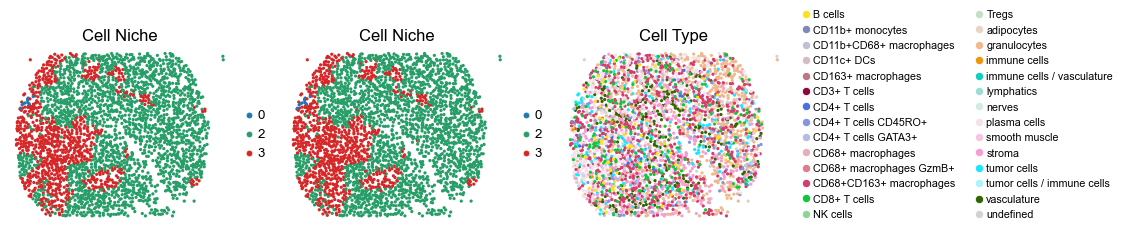
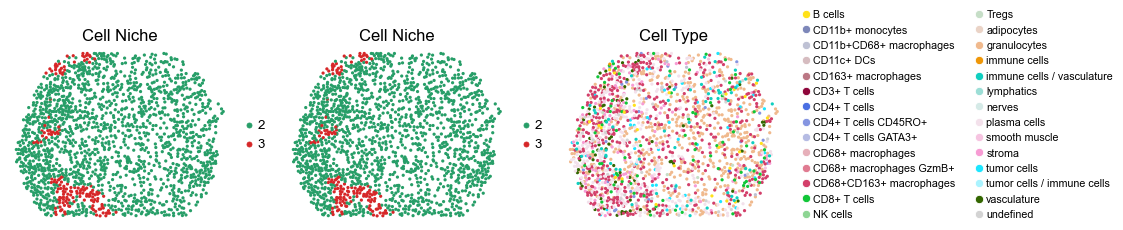
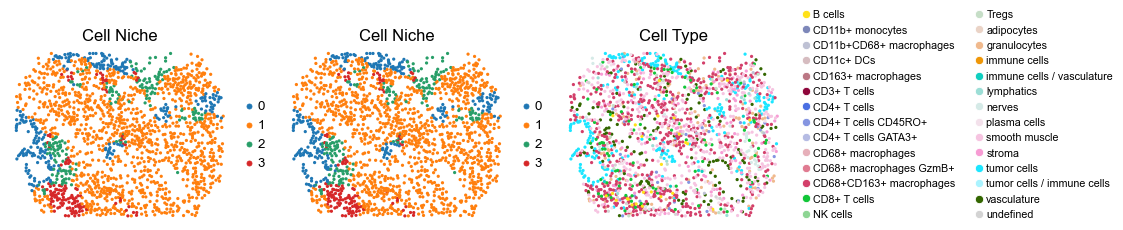
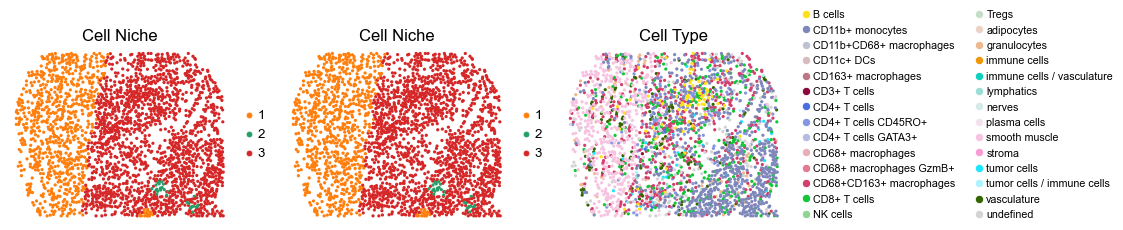
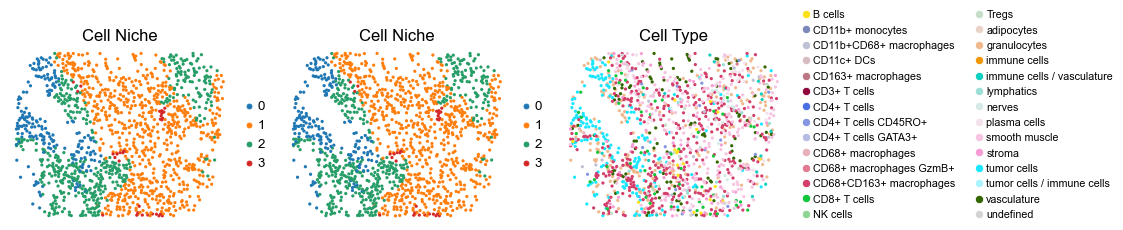
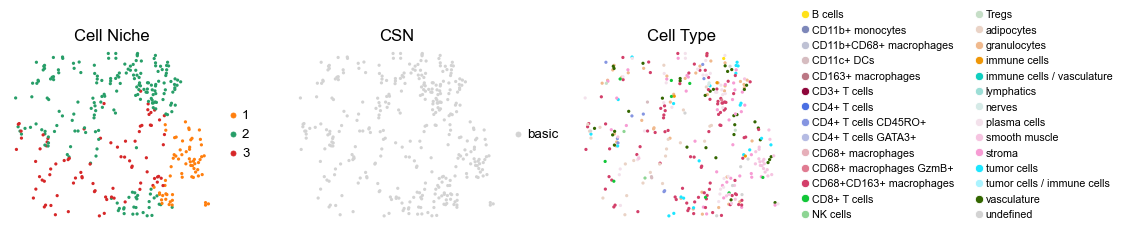
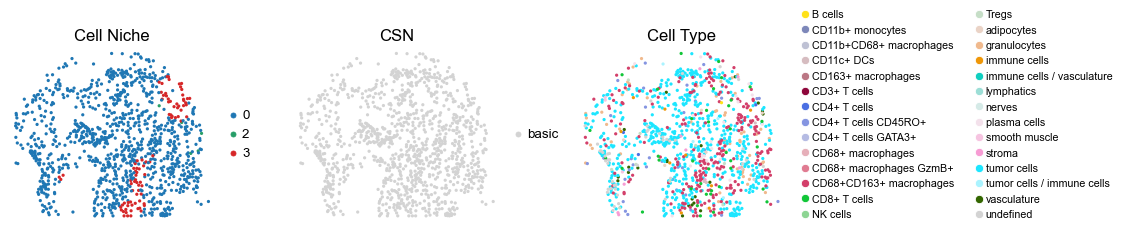
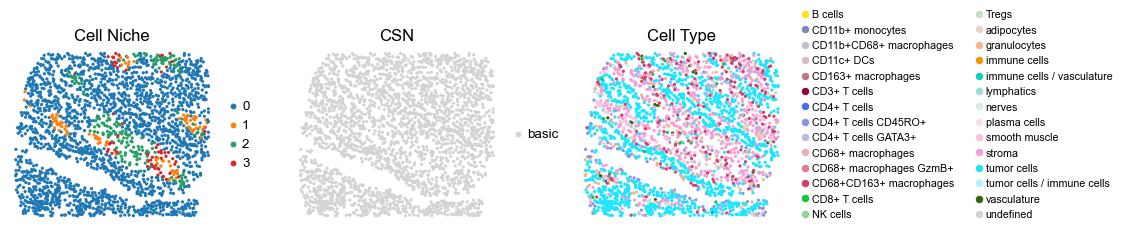
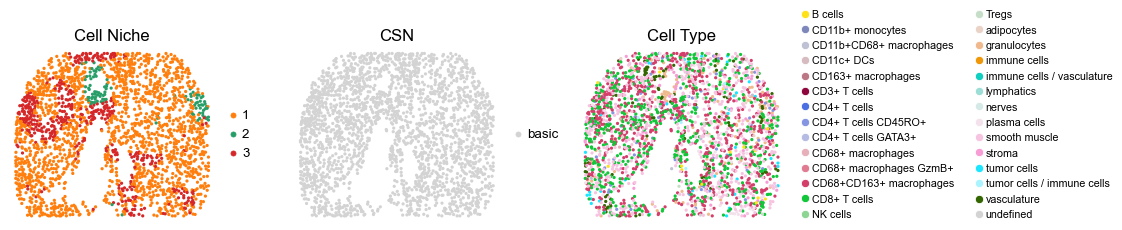
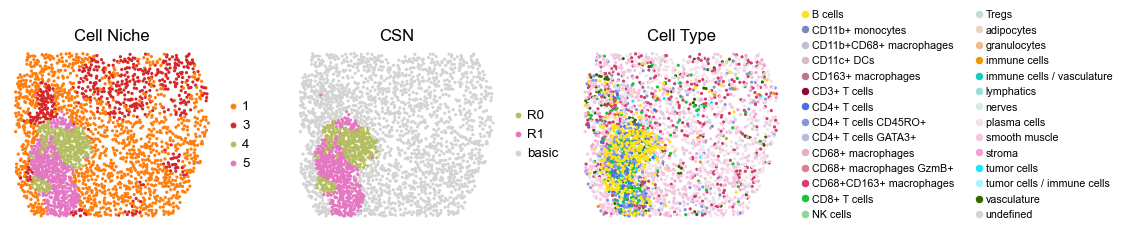
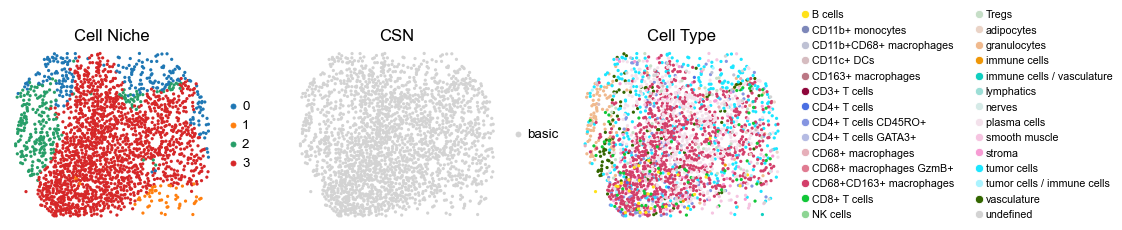
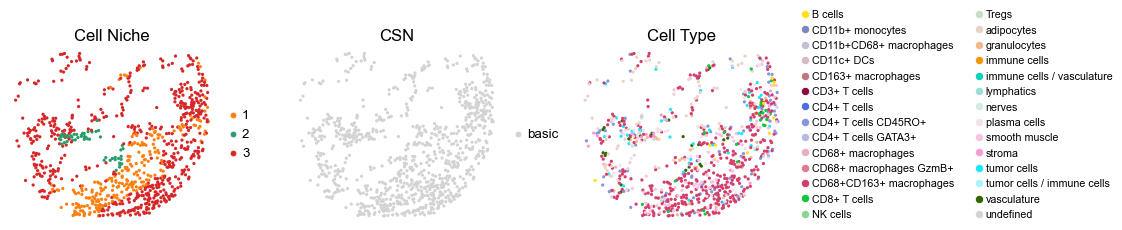
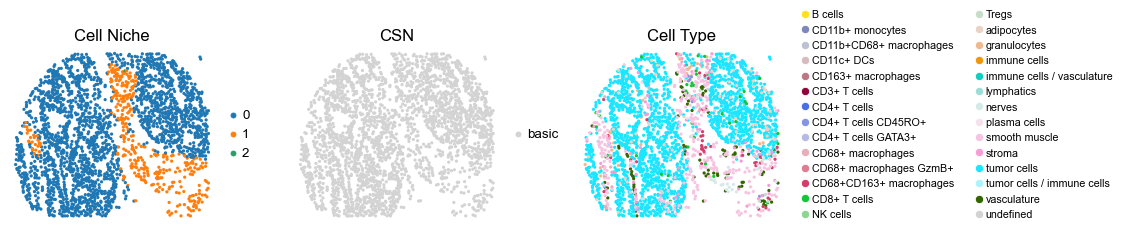
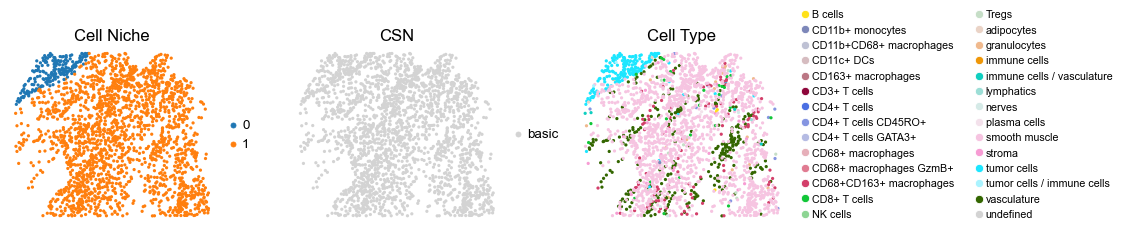
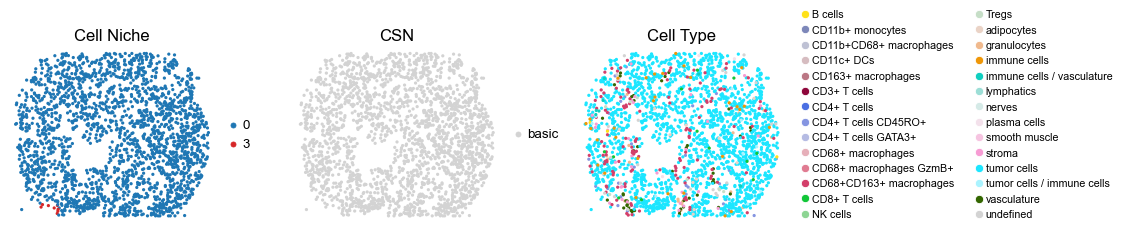
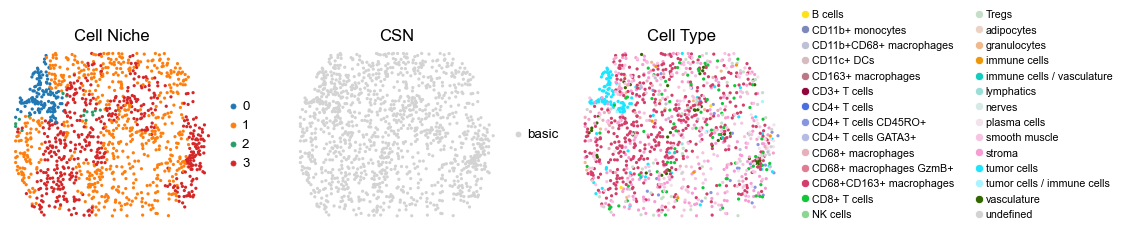
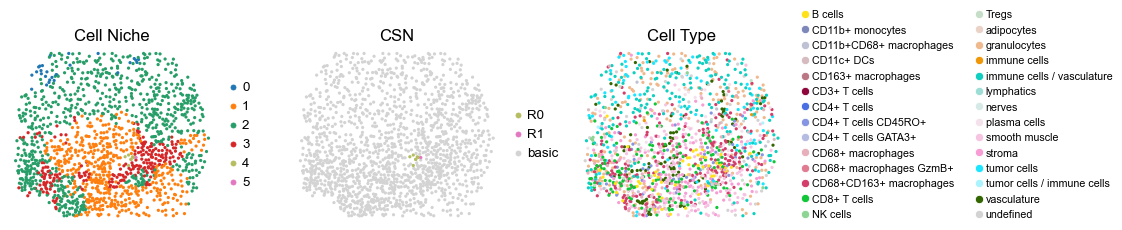
Control group (DII group)
[11]:
for i in range(len(slice_name_list)):

    print(slice_name_list[i])
    adata = adata_concat_new[adata_concat_new.obs['slice_name'] == slice_name_list[i], :].copy()
    print(adata.shape[0])

    fig, axes = plt.subplots(1, 3, figsize=(19, 4))

    sc.pl.embedding(adata, basis='spatial', color='niche_label', palette=niche_color_dict,
                    ax=axes[0], s=60, show=False, frameon=False, title='Cell Niche', legend_fontsize=16)
    axes[0].set_title('Cell Niche', fontsize=20)

    sc.pl.embedding(adata, basis='spatial', color='niche_label', palette=niche_color_dict,
                    ax=axes[1], s=60, show=False, frameon=False, title='Cell Niche', legend_fontsize=16)
    axes[1].set_title('Cell Niche', fontsize=20)

    sc.pl.embedding(adata, basis='spatial', color='ClusterName', palette=ct_color_dict,
                    ax=axes[2], s=60, show=False, frameon=False, title='Cell Type', legend_fontsize=16)
    axes[2].set_title('Cell Type', fontsize=20)

    ct_legend_elements = [
        Line2D([0], [0], marker='o', color='w', label=label,
            markerfacecolor=color, markersize=10)
        for label, color in ct_color_dict.items()
    ]
    axes[2].legend(handles=ct_legend_elements, loc=(1.05, 0), frameon=False, ncol=2)
    axes[2].axis('off')

    plt.tight_layout()
    plt.show()
reg003_A_patient2_group2
1264
reg003_B_patient2_group2
1231
reg004_A_patient2_group2
1475
reg004_B_patient2_group2
1892
reg005_A_patient3_group2
2552
reg005_B_patient3_group2
1657
reg006_A_patient3_group2
1376
reg006_B_patient3_group2
2086
reg007_A_patient4_group2
3008
reg007_B_patient4_group2
2343
reg008_A_patient4_group2
1397
reg008_B_patient4_group2
3322
reg009_A_patient5_group2
2428
reg009_B_patient5_group2
3394
reg010_A_patient5_group2
2077
reg010_B_patient5_group2
1250
reg013_A_patient7_group2
1625
reg013_B_patient7_group2
1964
reg014_A_patient7_group2
961
reg014_B_patient7_group2
2114
reg015_A_patient8_group2
2454
reg015_B_patient8_group2
1574
reg016_A_patient8_group2
1948
reg016_B_patient8_group2
2396
reg017_A_patient9_group2
2666
reg017_B_patient9_group2
2784
reg018_A_patient9_group2
2029
reg018_B_patient9_group2
2504
reg027_A_patient14_group2
2389
reg027_B_patient14_group2
1956
reg028_A_patient14_group2
2291
reg028_B_patient14_group2
2201
reg029_A_patient15_group2
2670
reg029_B_patient15_group2
2020
reg030_A_patient15_group2
2268
reg030_B_patient15_group2
2093
reg031_A_patient16_group2
2560
reg031_B_patient16_group2
2124
reg032_A_patient16_group2
2719
reg032_B_patient16_group2
1593
reg035_A_patient18_group2
2726
reg035_B_patient18_group2
2247
reg036_A_patient18_group2
3338
reg036_B_patient18_group2
3253
reg043_A_patient22_group2
1874
reg043_B_patient22_group2
582
reg044_A_patient22_group2
1019
reg044_B_patient22_group2
433
reg045_A_patient23_group2
2668
reg045_B_patient23_group2
978
reg046_A_patient23_group2
2133
reg046_B_patient23_group2
2307
reg049_A_patient25_group2
2429
reg049_B_patient25_group2
1252
reg050_A_patient25_group2
1072
reg050_B_patient25_group2
1603
reg051_A_patient26_group2
1615
reg051_B_patient26_group2
1780
reg052_A_patient26_group2
1930
reg052_B_patient26_group2
2177
reg053_A_patient27_group2
1998
reg053_B_patient27_group2
146
reg054_A_patient27_group2
1603
reg054_B_patient27_group2
302
reg059_A_patient30_group2
2877
reg059_B_patient30_group2
1815
reg060_A_patient30_group2
2396
reg060_B_patient30_group2
2295
reg061_A_patient31_group2
1917
reg061_B_patient31_group2
1780
reg062_A_patient31_group2
2478
reg062_B_patient31_group2
1384
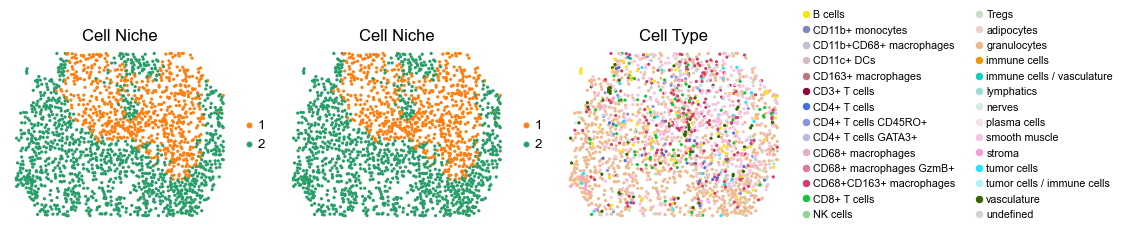
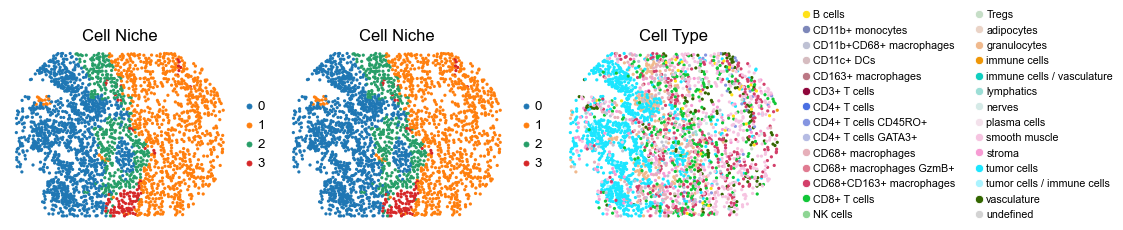
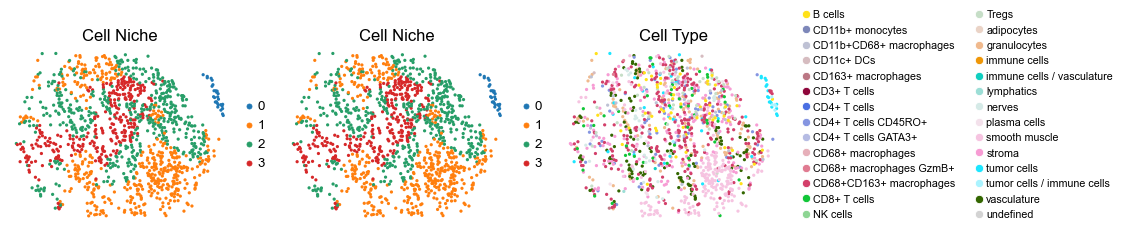
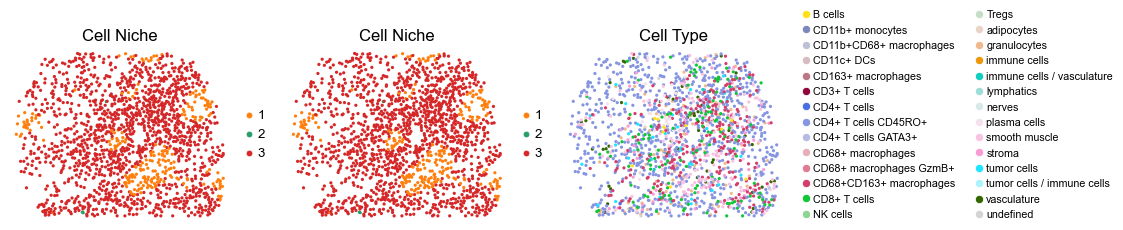
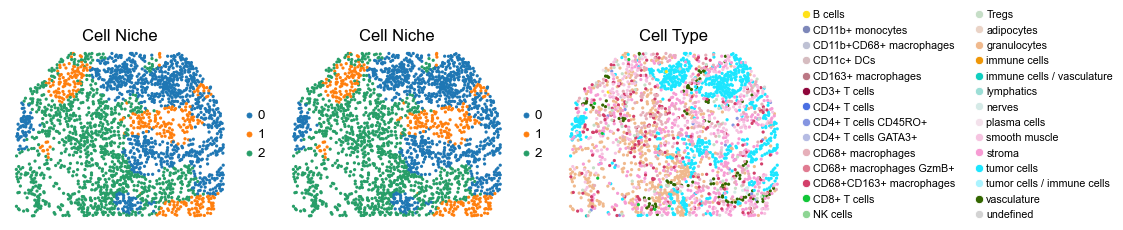
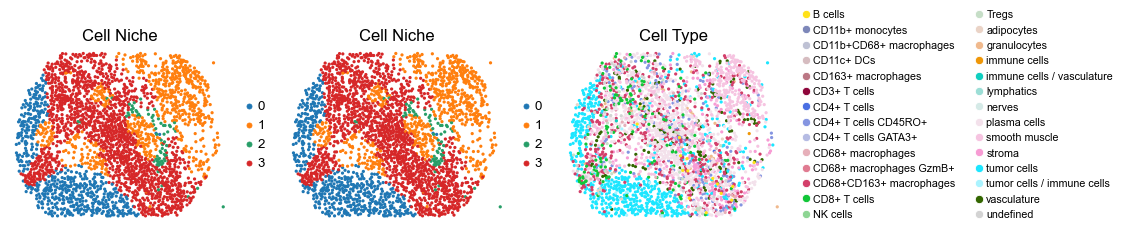
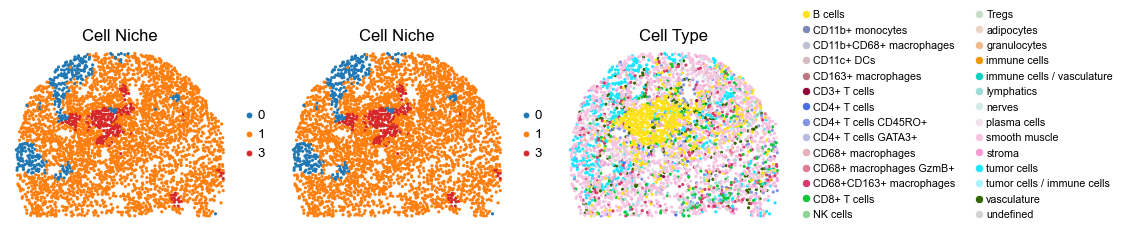
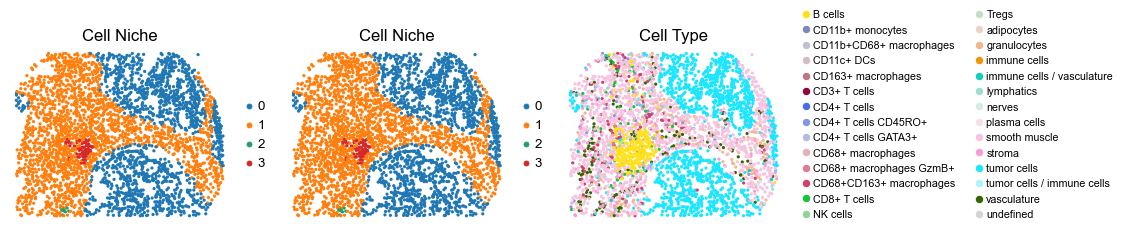
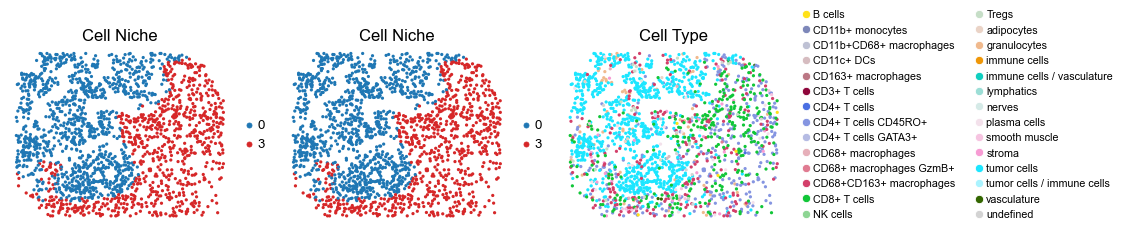
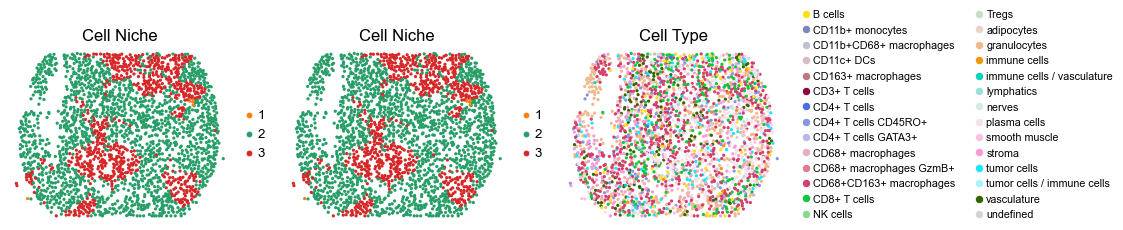
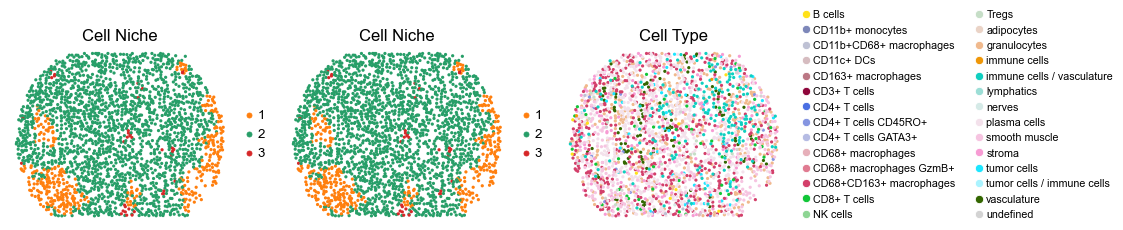
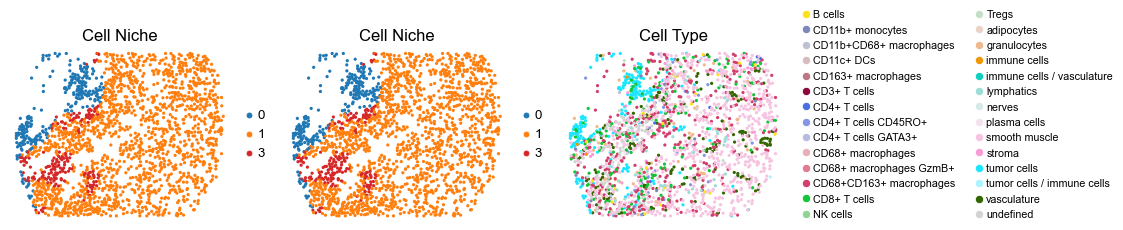
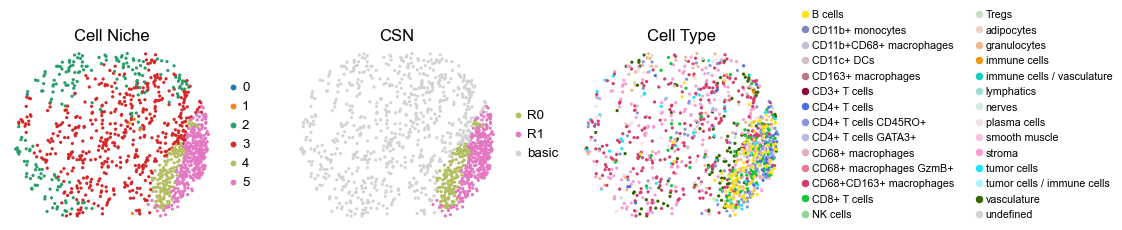
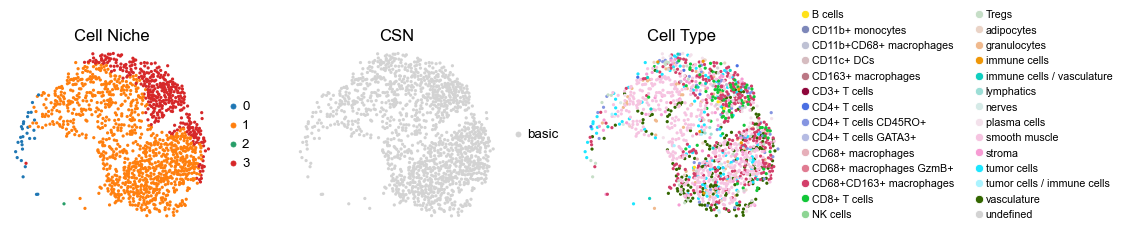
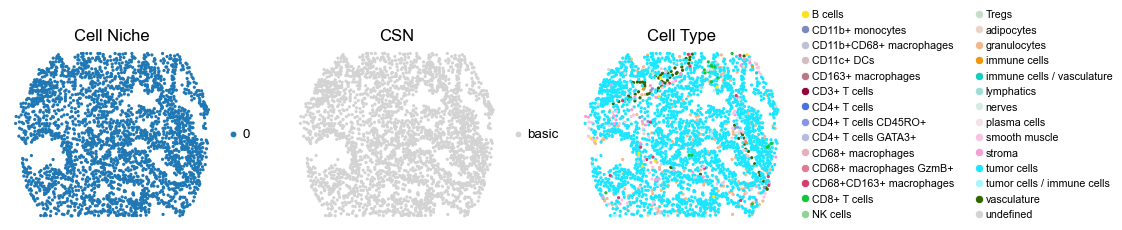
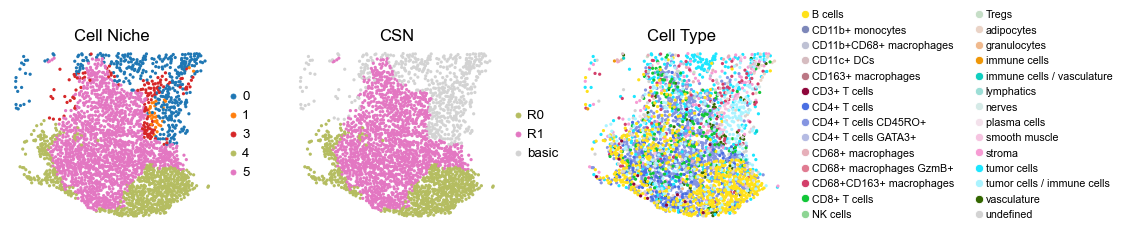
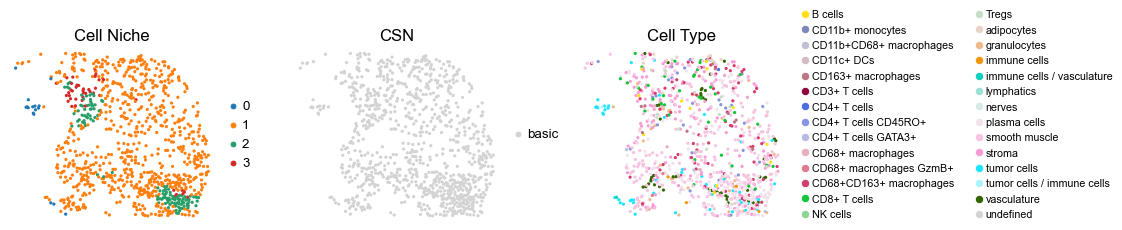
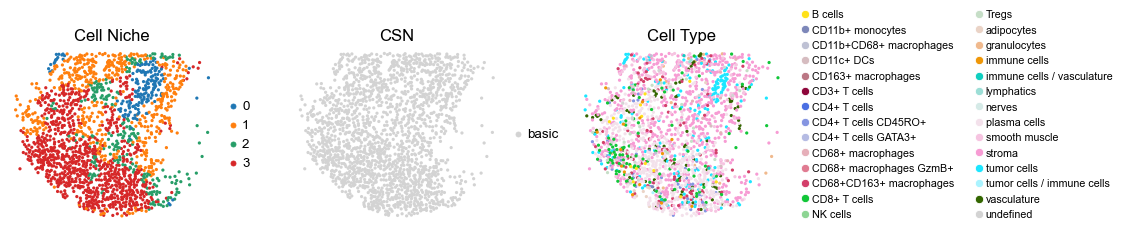
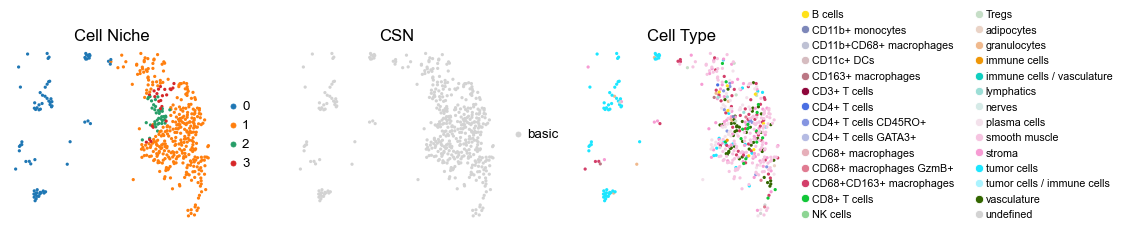
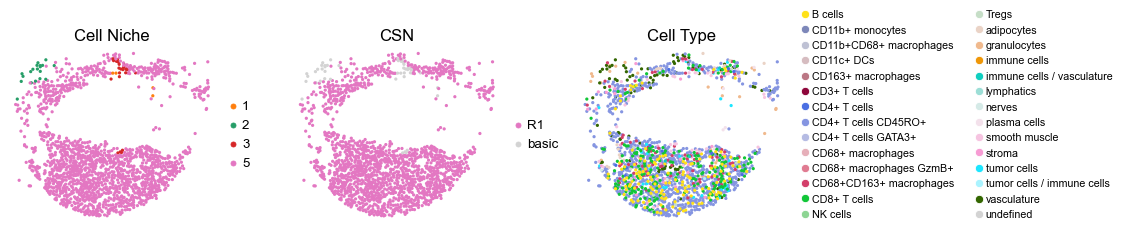
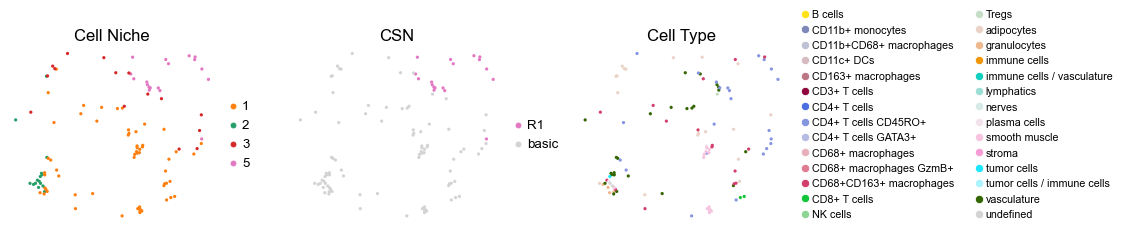
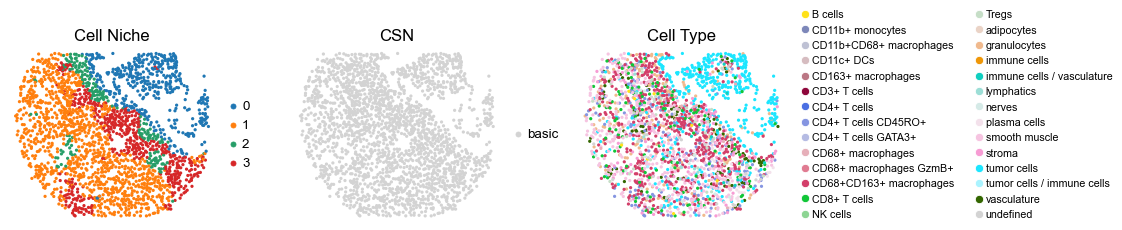
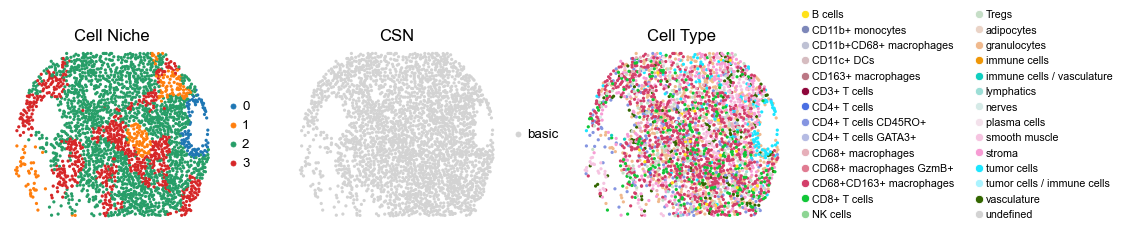
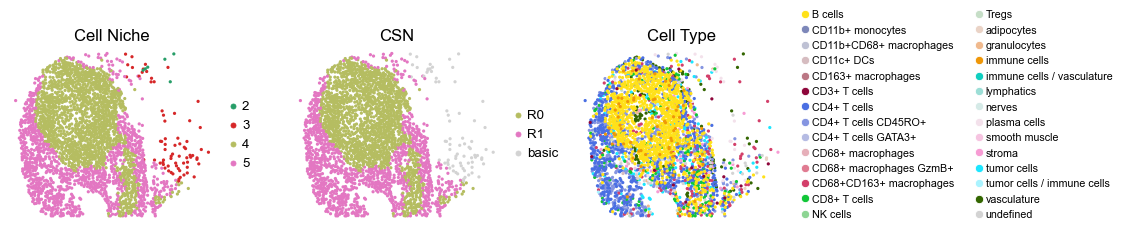
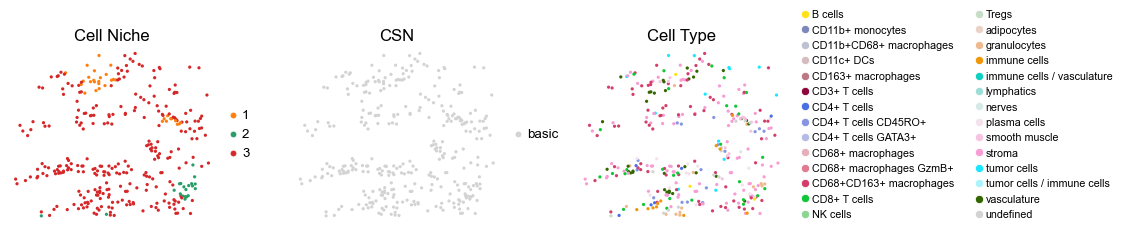
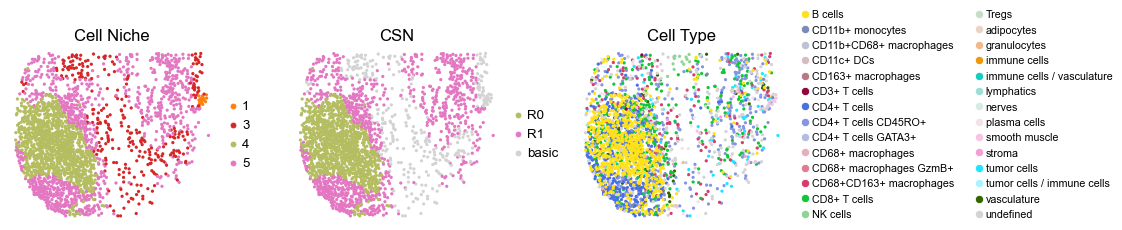
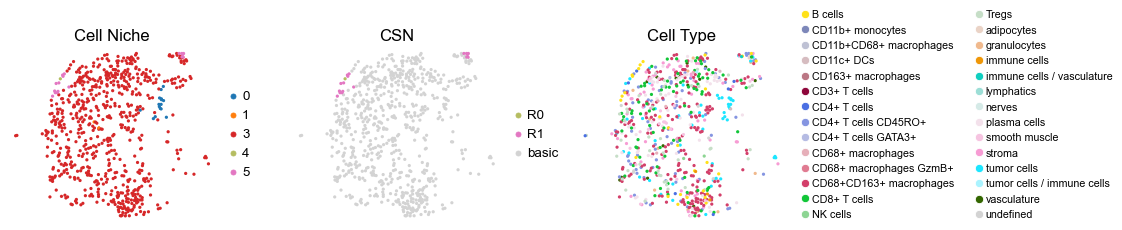
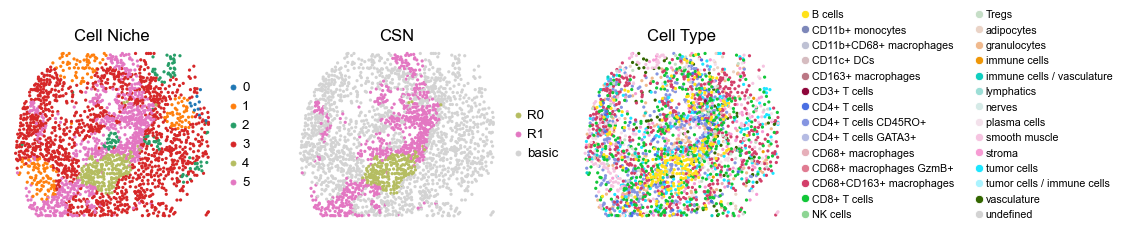
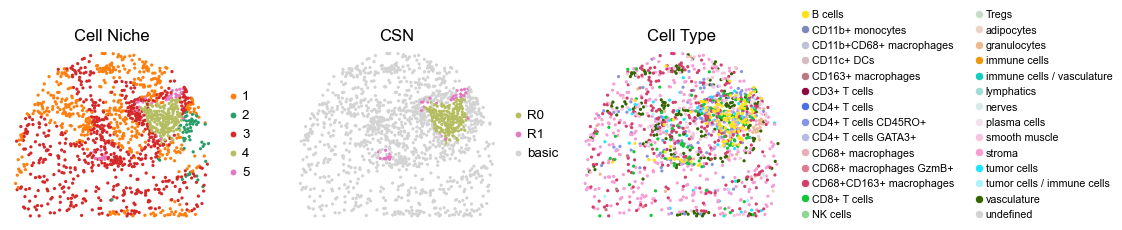
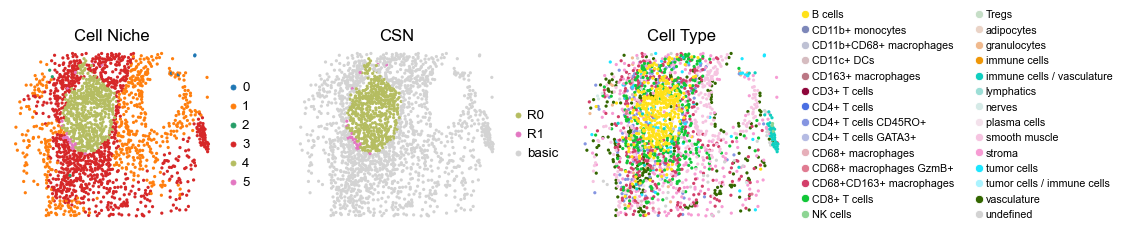
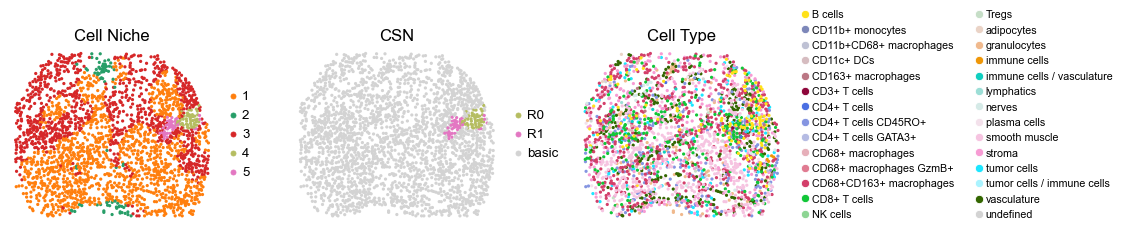
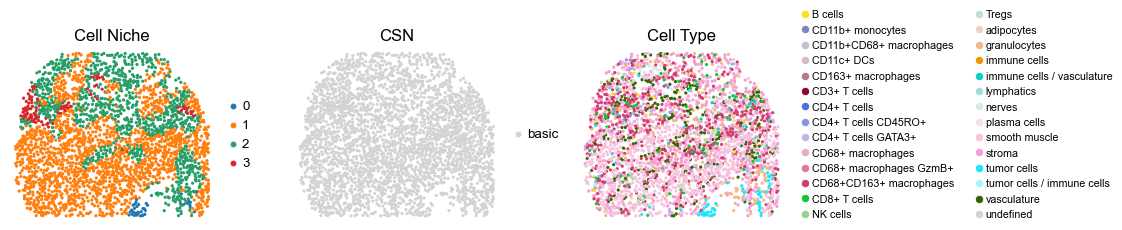
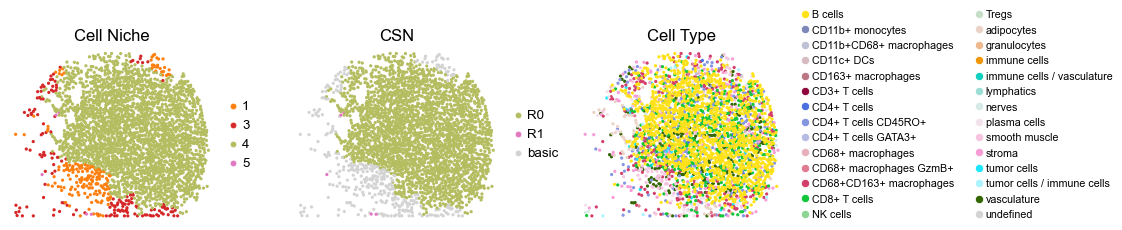
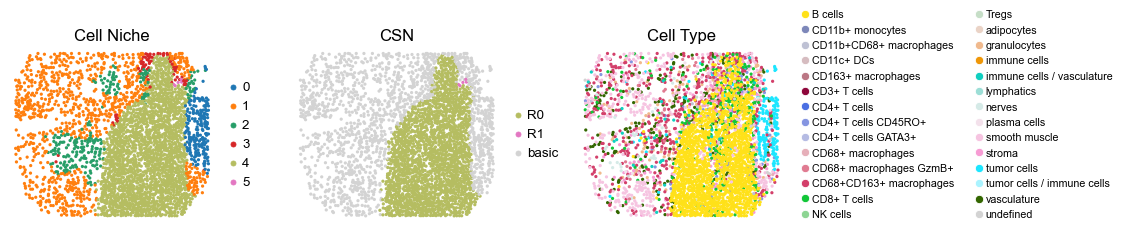
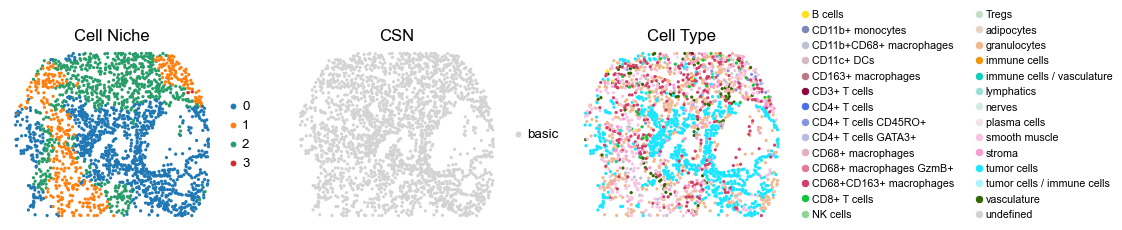
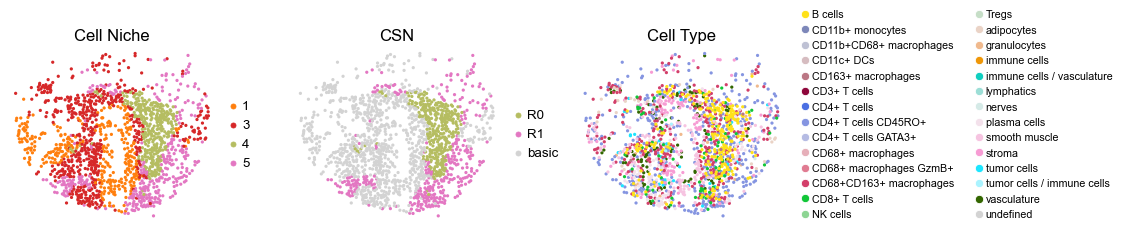
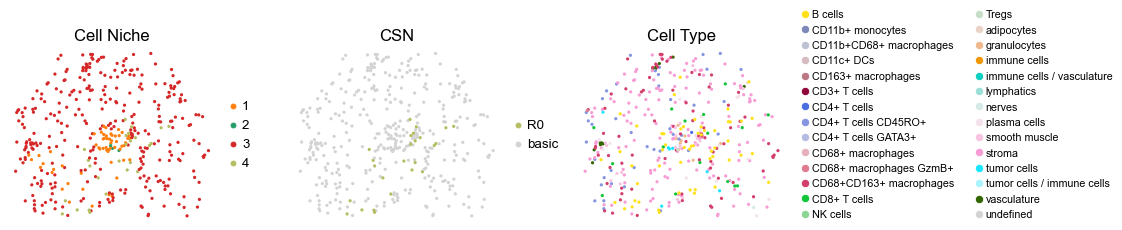
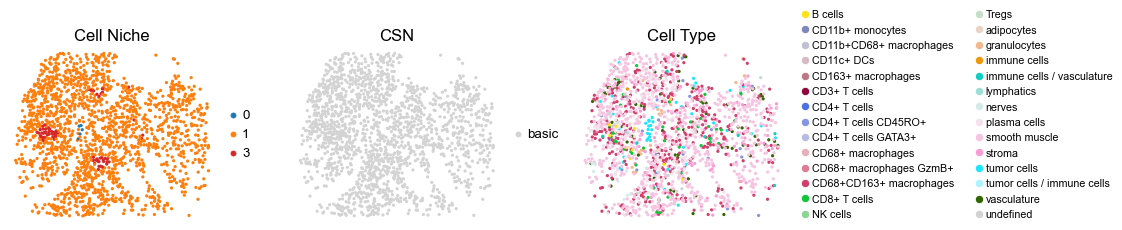
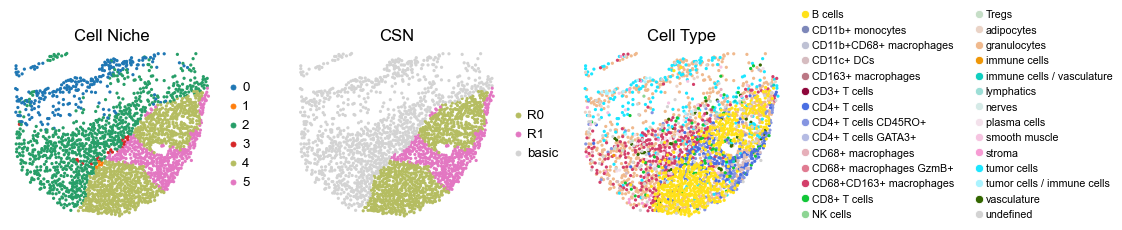
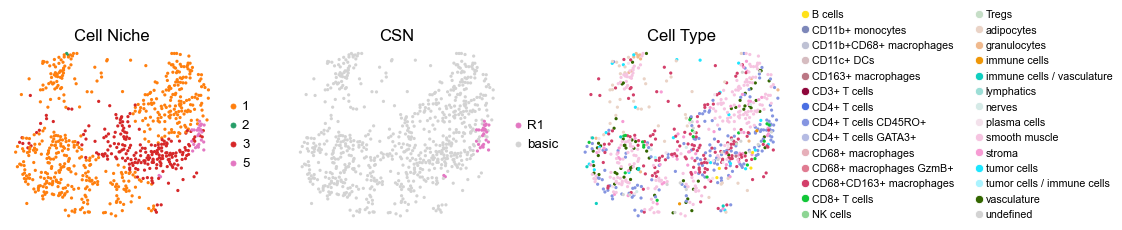
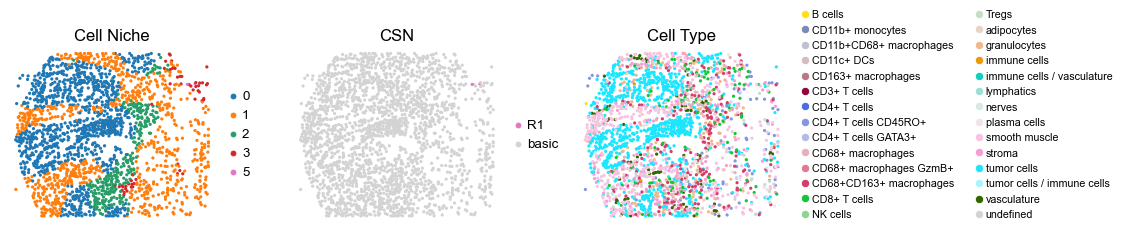
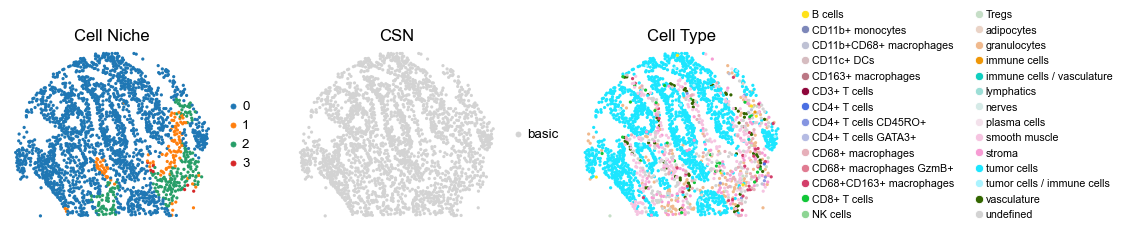
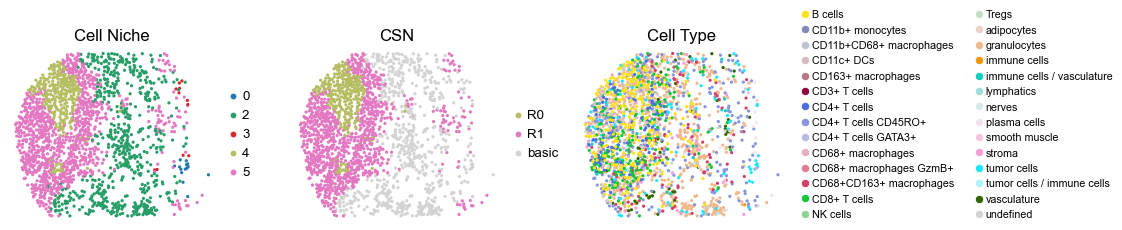
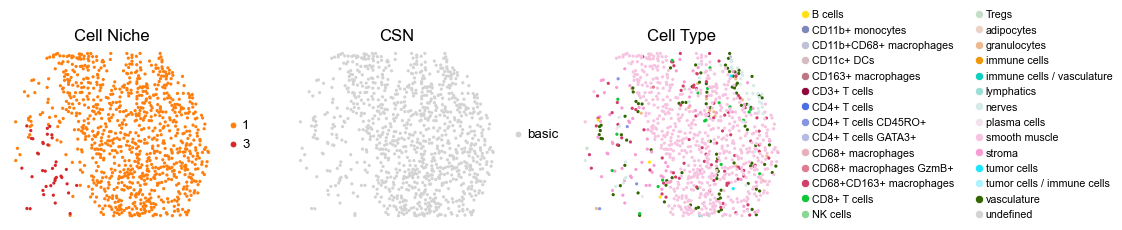
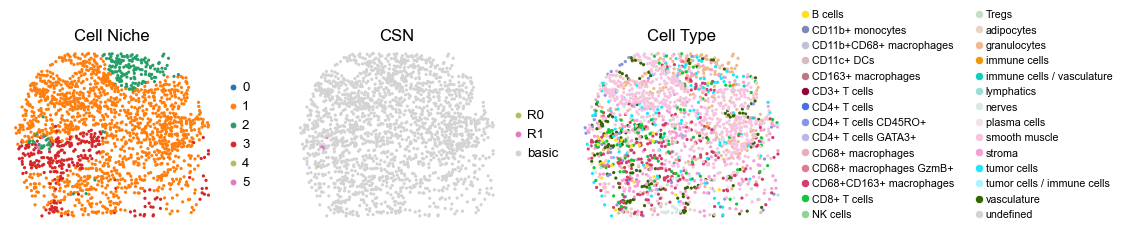
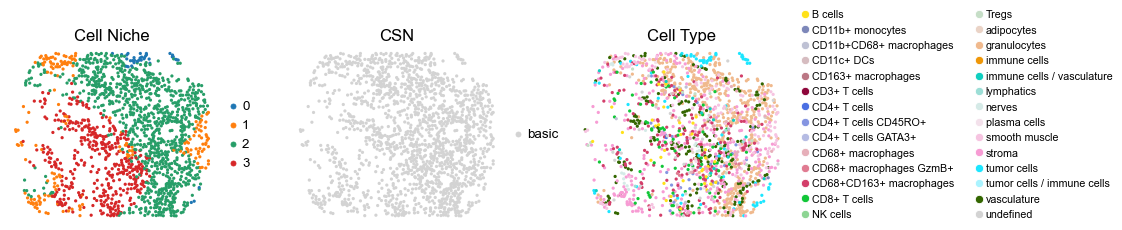
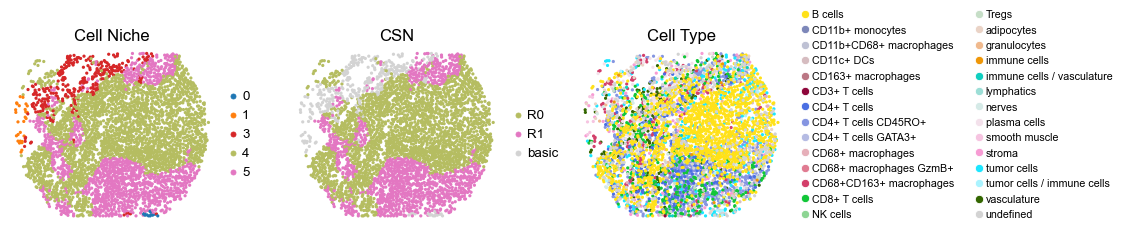
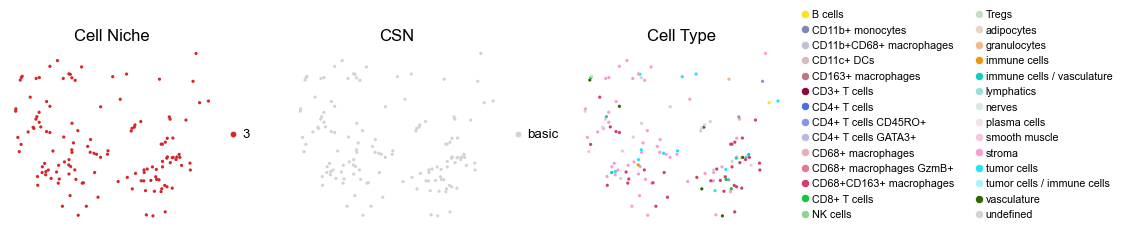
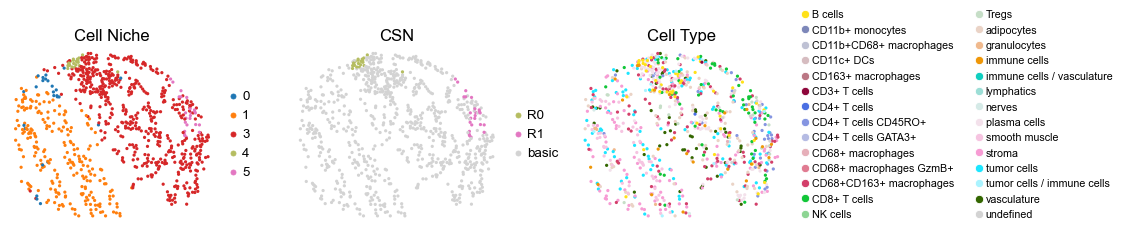
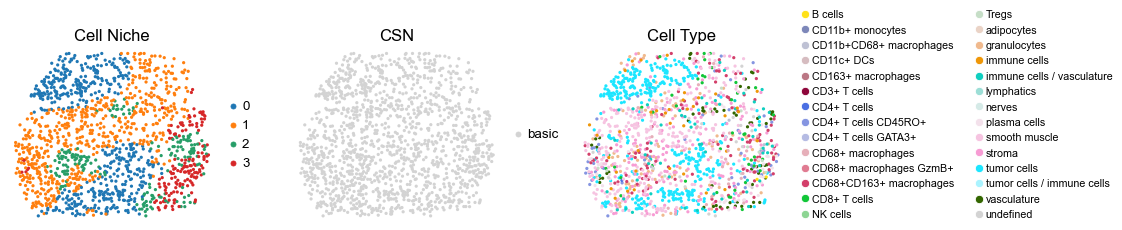
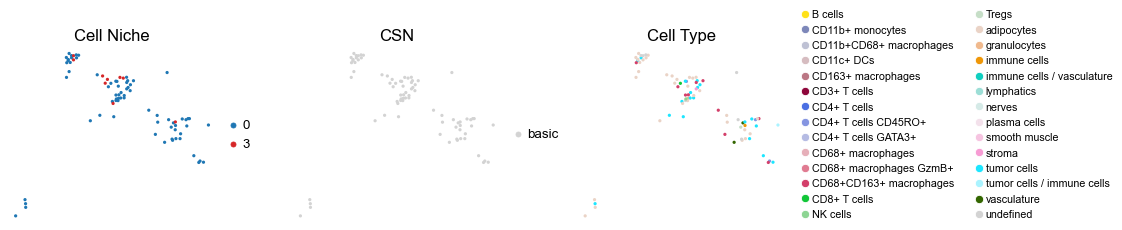
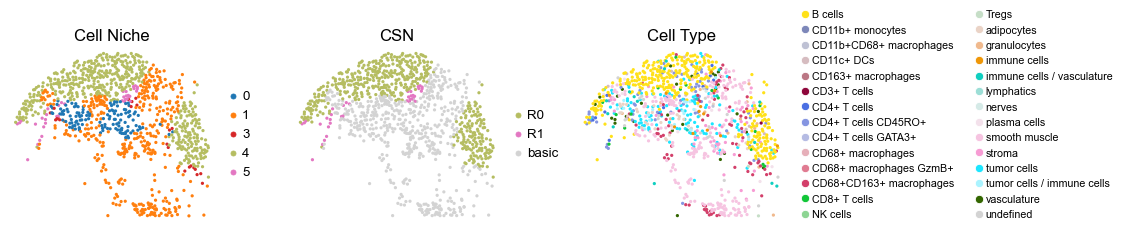
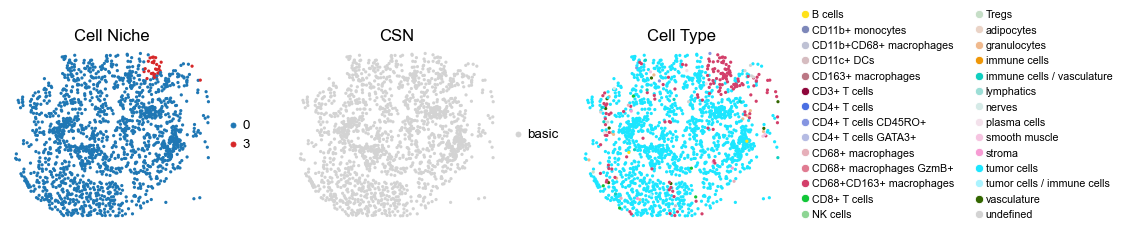
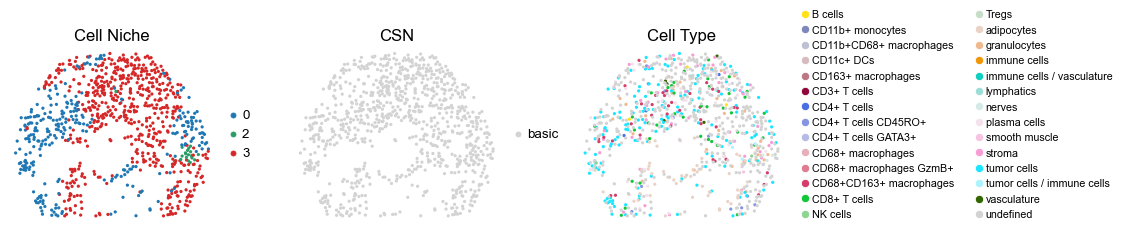
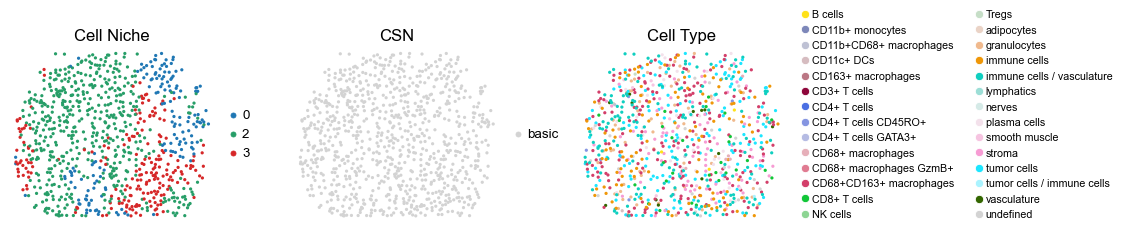
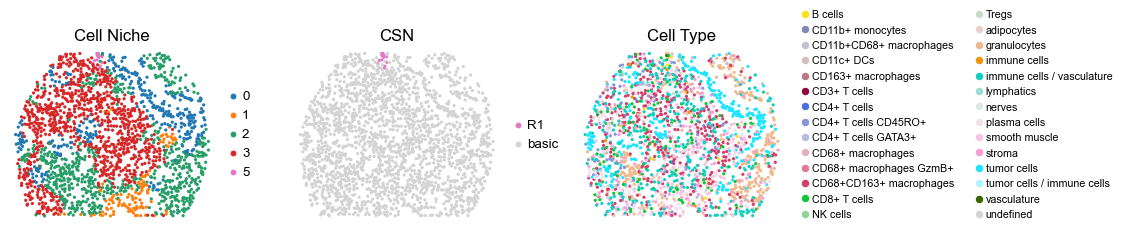
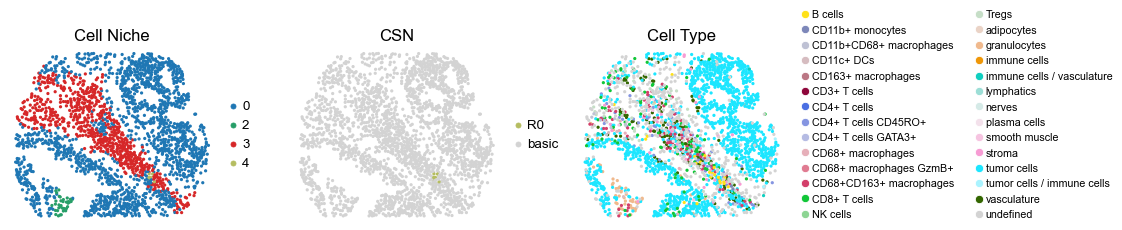
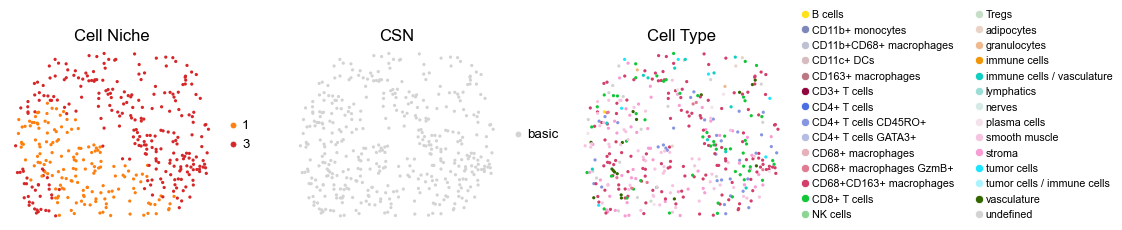
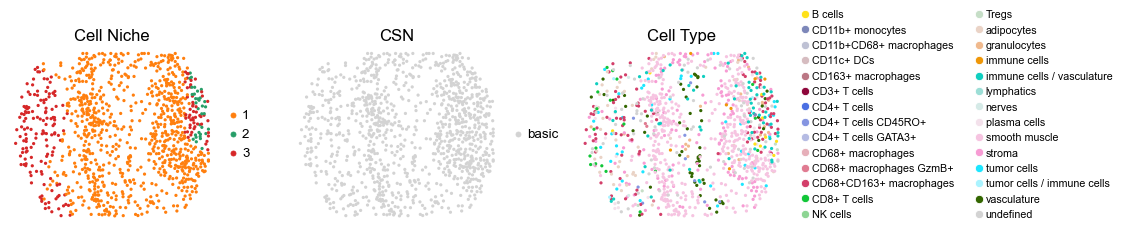
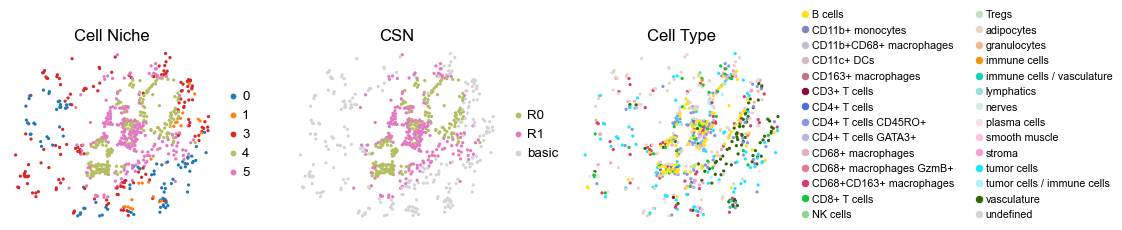
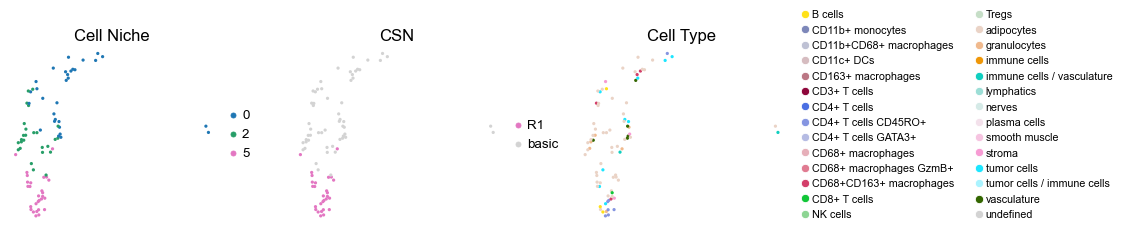
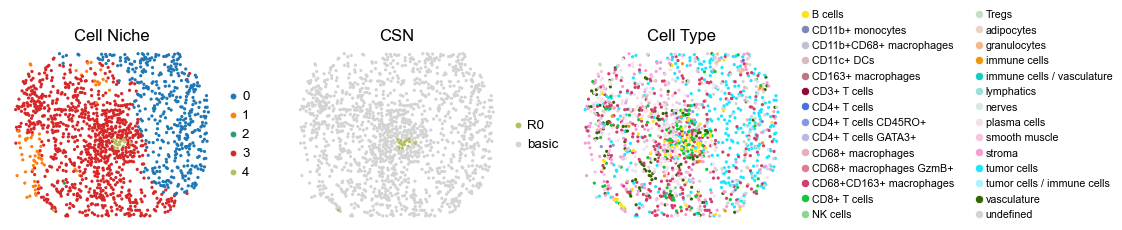
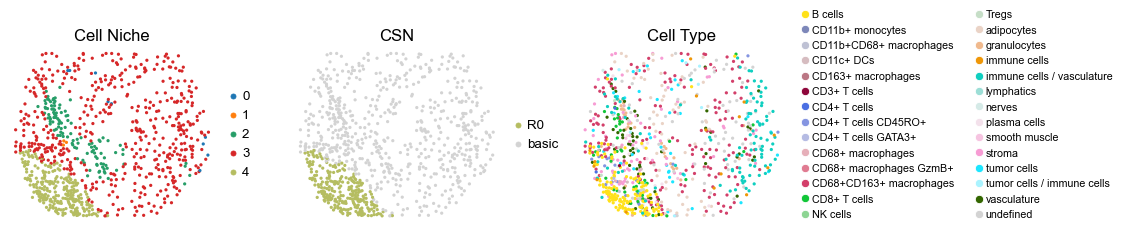
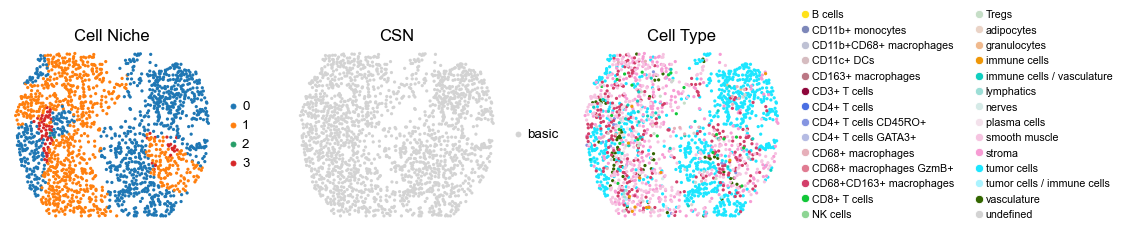
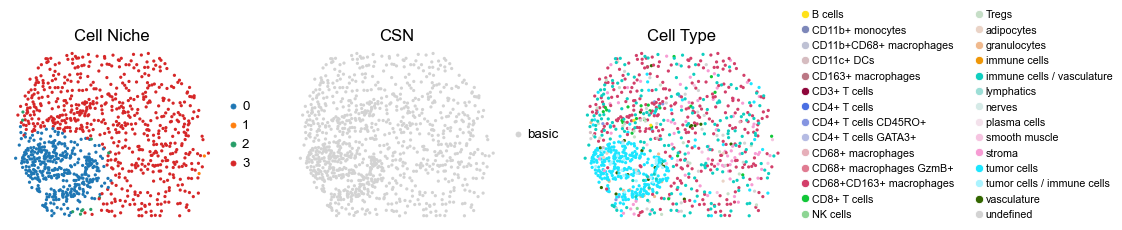
Case group (CLR group)
[12]:
for i in range(len(cond_name_list)):

    print(cond_name_list[i])
    adata = cond_concat_new[cond_concat_new.obs['slice_name'] == cond_name_list[i], :].copy()
    print(adata.shape[0])

    fig, axes = plt.subplots(1, 3, figsize=(19, 4))

    sc.pl.embedding(adata, basis='spatial', color='niche_label', palette=niche_color_dict,
                    ax=axes[0], s=60, show=False, frameon=False, title='Cell Niche', legend_fontsize=16)
    axes[0].set_title('Cell Niche', fontsize=20)

    # adata.obs['ClusterName'] = ['granulocytes' if x == 'granulocytes' else 'other' for x in adata.obs['ClusterName']]
    # ct_color_dict.update({'other': '#d3d3d3'})
    sc.pl.embedding(adata, basis='spatial', color='csn_label', palette=csn_color_dict,
                    ax=axes[1], s=60, show=False, frameon=False, title='CSN', legend_fontsize=16)
    axes[1].set_title('CSN', fontsize=20)

    sc.pl.embedding(adata, basis='spatial', color='ClusterName', palette=ct_color_dict,
                    ax=axes[2], s=60, show=False, frameon=False, title='Cell Type', legend_fontsize=16)
    axes[2].set_title('Cell Type', fontsize=20)

    ct_legend_elements = [
        Line2D([0], [0], marker='o', color='w', label=label,
            markerfacecolor=color, markersize=10)
        for label, color in ct_color_dict.items()
    ]
    axes[2].legend(handles=ct_legend_elements, loc=(1.05, 0), frameon=False, ncol=2)
    axes[2].axis('off')

    plt.tight_layout()
    plt.show()
reg001_A_patient1_group1
1107
reg001_B_patient1_group1
349
reg002_A_patient1_group1
1373
reg002_B_patient1_group1
2623
reg011_A_patient6_group1
2746
reg011_B_patient6_group1
917
reg012_A_patient6_group1
1762
reg012_B_patient6_group1
475
reg019_A_patient10_group1
1555
reg019_B_patient10_group1
107
reg020_A_patient10_group1
2136
reg020_B_patient10_group1
2668
reg021_A_patient11_group1
2663
reg021_B_patient11_group1
332
reg022_A_patient11_group1
2125
reg022_B_patient11_group1
690
reg023_B_patient12_group1
2372
reg024_A_patient12_group1
1095
reg024_B_patient12_group1
2373
reg025_A_patient13_group1
1345
reg025_B_patient13_group1
1968
reg026_A_patient13_group1
2331
reg026_B_patient13_group1
2734
reg033_A_patient17_group1
2797
reg033_B_patient17_group1
3429
reg034_A_patient17_group1
2153
reg034_B_patient17_group1
2104
reg037_A_patient19_group1
1539
reg037_B_patient19_group1
402
reg038_A_patient19_group1
2622
reg038_B_patient19_group1
1663
reg039_A_patient20_group1
2421
reg039_B_patient20_group1
767
reg040_A_patient20_group1
2134
reg040_B_patient20_group1
851
reg041_A_patient21_group1
2166
reg041_B_patient21_group1
2233
reg042_A_patient21_group1
2564
reg042_B_patient21_group1
2077
reg047_A_patient24_group1
1838
reg047_B_patient24_group1
962
reg048_A_patient24_group1
1794
reg048_B_patient24_group1
1590
reg055_A_patient28_group1
3796
reg055_B_patient28_group1
135
reg056_A_patient28_group1
815
reg056_B_patient28_group1
1394
reg057_A_patient29_group1
80
reg057_B_patient29_group1
1052
reg058_A_patient29_group1
2239
reg058_B_patient29_group1
1630
reg063_A_patient32_group1
890
reg063_B_patient32_group1
891
reg064_B_patient32_group1
1969
reg065_A_patient33_group1
2283
reg065_B_patient33_group1
420
reg066_B_patient33_group1
1041
reg067_A_patient34_group1
674
reg067_B_patient34_group1
84
reg068_A_patient34_group1
1241
reg068_B_patient34_group1
1458
reg069_A_patient35_group1
1432
reg069_B_patient35_group1
859
reg070_A_patient35_group1
1829
reg070_B_patient35_group1
1010
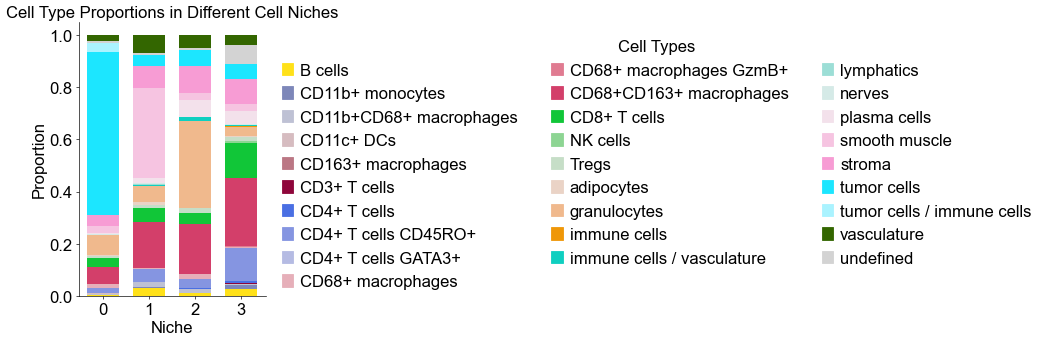
Cell type composition (control group)
[13]:
basic_niche_labels = adata_concat_new.uns['niche_label_summary'].copy()
ct_labels = sorted(cond_concat_new.obs['ClusterName'].unique())
basic_niche_dist = adata_concat_new.uns['niche_dist'].toarray().copy()
basic_cell_count_niche = adata_concat_new.uns['niche_cell_count'].copy()

fig, ax = plt.subplots(figsize=(4, 6))
bar_width = 0.7
n_niches, n_cell_types = basic_niche_dist.shape

x = np.arange(n_niches)

for j in range(n_cell_types):
    bottom = np.sum(basic_niche_dist[:, :j], axis=1)
    ax.bar(x,
           basic_niche_dist[:, j],
           bottom=bottom,
           width=bar_width,
           color=ct_color_dict[ct_labels[j]],
           label=ct_labels[j])

ax.set_ylabel('Proportion', fontsize=20)
ax.set_xlabel('Niche', fontsize=20)
ax.set_xticks(x)
ax.set_xticklabels(basic_niche_labels, rotation=0, ha='center')
ax.tick_params(axis='x', labelsize=20)
ax.tick_params(axis='y', labelsize=20)
ax.spines['top'].set_visible(False)
ax.spines['right'].set_visible(False)
ax.grid(False)

handles = [
    mpatches.Patch(color=color, label=ct)
    for ct, color in zip(celltypes, ct_colors)
]

ax.legend(handles=handles, title='Cell Types', loc=(1.05, 0.0), frameon=False, handleheight=0.8,
          handlelength=0.7, ncol=3, fontsize=20, title_fontsize=20)

plt.title('Cell Type Proportions in Different Cell Niches', fontsize=20)
plt.tight_layout()
plt.show()
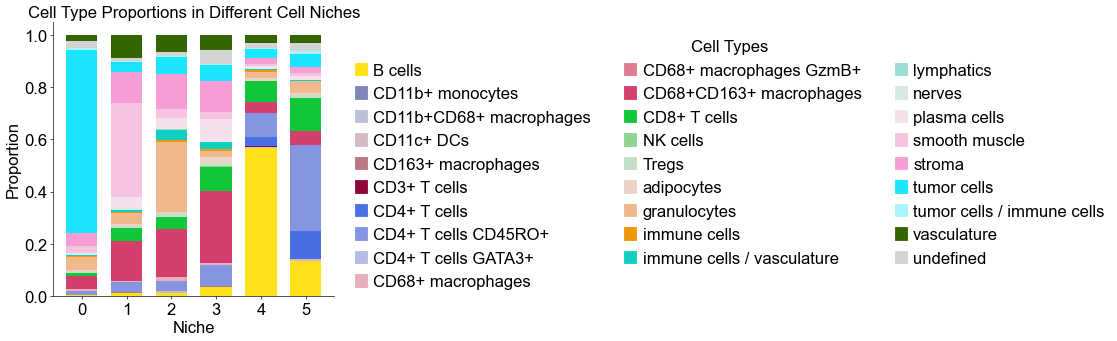
Cell type composition (case group)
[14]:
cond_niche_labels = cond_concat_new.uns['niche_label_summary'].copy()
ct_labels = sorted(cond_concat_new.obs['ClusterName'].unique())
cond_niche_dist = cond_concat_new.uns['niche_dist'].toarray().copy()
cond_cell_count_niche = cond_concat_new.uns['niche_cell_count'].copy()

fig, ax = plt.subplots(figsize=(6, 6))
bar_width = 0.7
n_niches, n_cell_types = cond_niche_dist.shape

x = np.arange(n_niches)

for j in range(n_cell_types):
    bottom = np.sum(cond_niche_dist[:, :j], axis=1)
    ax.bar(x,
           cond_niche_dist[:, j],
           bottom=bottom,
           width=bar_width,
           color=ct_color_dict[ct_labels[j]],
           label=ct_labels[j])

ax.set_ylabel('Proportion', fontsize=20)
ax.set_xlabel('Niche', fontsize=20)
ax.set_xticks(x)
ax.set_xticklabels(cond_niche_labels, rotation=0, ha='center')
ax.tick_params(axis='x', labelsize=20)
ax.tick_params(axis='y', labelsize=20)
ax.spines['top'].set_visible(False)
ax.spines['right'].set_visible(False)
ax.grid(False)

handles = [
    mpatches.Patch(color=color, label=ct)
    for ct, color in zip(celltypes, ct_colors)
]

ax.legend(handles=handles, title='Cell Types', loc=(1.05, 0.0), frameon=False, handleheight=0.8,
          handlelength=0.7, ncol=3, fontsize=20, title_fontsize=20)

plt.title('Cell Type Proportions in Different Cell Niches', fontsize=20)
plt.tight_layout()
plt.show()
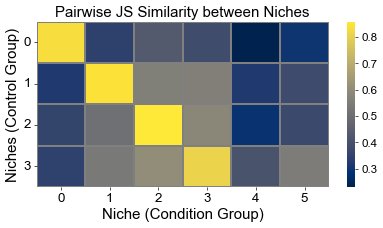
Calculate the similarity between niches from different groups
Similarities are measured using 1-JSD score
[15]:
from scipy.spatial.distance import jensenshannon
from scipy.stats import pearsonr
from sklearn.metrics.pairwise import cosine_similarity
basic_niche_dist = adata_concat_new.uns['niche_dist'].toarray().copy()
cond_niche_dist = cond_concat_new.uns['niche_dist'].toarray().copy()
basic_niche_labels = adata_concat_new.uns['niche_label_summary'].copy()
cond_niche_labels = cond_concat_new.uns['niche_label_summary'].copy()
n_niche_basic = basic_niche_dist.shape[0]
n_niche_cond = cond_niche_dist.shape[0]
js_sim = np.zeros((n_niche_basic, n_niche_cond))
# cos_sim = cosine_similarity(basic_niche_dist, cond_niche_dist)
# corr_sim = np.zeros((n_niche_basic, n_niche_cond))
for i in range(n_niche_basic):
for j in range(n_niche_cond):
js_sim[i, j] = 1 - jensenshannon(basic_niche_dist[i], cond_niche_dist[j], base=2)
# corr_sim[i, j], _ = pearsonr(basic_niche_dist[i], cond_niche_dist[j])
plt.figure(figsize=(7, 4))
sns.heatmap(
js_sim,
cmap='cividis',
xticklabels=cond_niche_labels,
yticklabels=basic_niche_labels,
linewidths=0.5,
linecolor='gray',
)
plt.xlabel("Niche (Condition Group)", fontsize=18)
plt.ylabel("Niches (Control Group)", fontsize=18)
plt.title("Pairwise JS Similarity between Niches", fontsize=18)
plt.xticks(fontsize=16, rotation=0)
plt.yticks(fontsize=16, rotation=0)
plt.grid(False)
plt.tight_layout()
plt.show()
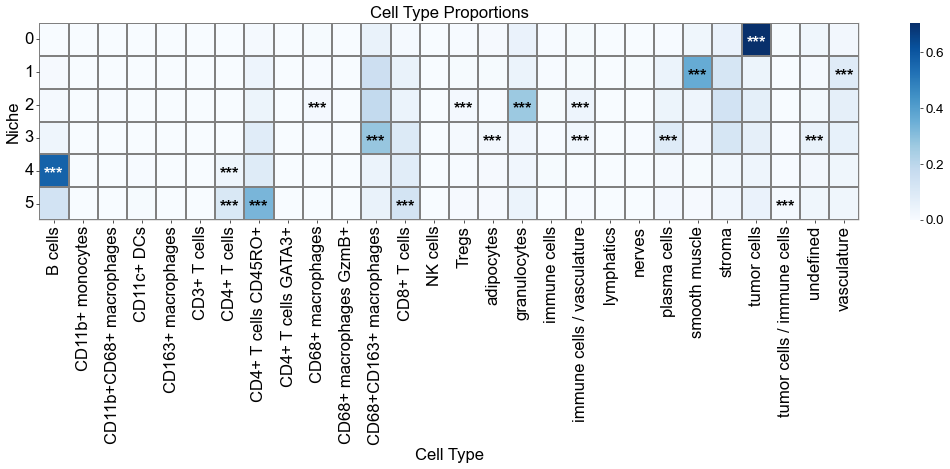
Cell type enrichment analysis
[16]:
ct_df = ct_enrichment_test(cond_concat_new.uns['niche_dist'],
cond_concat_new.uns['niche_cell_count'],
cond_concat_new.uns['idx2ct'],
cond_concat_new.uns['niche_label_summary'],
method='fisher',
alpha=0.05,
fdr_method='fdr_by',
log2fc_threshold=1,
prop_threshold=0.01,
verbose=True,
)
ct_df.head()
6 niches and 28 cell types in total.
[16]:
| niche_idx | niche | celltype_idx | celltype | oddsratio | p-value | q-value | log2fc | prop | enrichment | |
|---|---|---|---|---|---|---|---|---|---|---|
| 0 | 0 | 0 | 0 | B cells | 0.014478 | 0.000000 | 0.000000 | -5.917665 | 0.002095 | False |
| 1 | 0 | 0 | 1 | CD11b+ monocytes | 0.120763 | 0.007724 | 0.059593 | -3.049283 | 0.000044 | False |
| 2 | 0 | 0 | 2 | CD11b+CD68+ macrophages | 0.646650 | 0.033574 | 0.240104 | -0.627945 | 0.001266 | False |
| 3 | 0 | 0 | 3 | CD11c+ DCs | 0.313695 | 0.000005 | 0.000047 | -1.670775 | 0.000567 | False |
| 4 | 0 | 0 | 4 | CD163+ macrophages | 0.134703 | 0.018278 | 0.134737 | -2.891742 | 0.000044 | False |
[17]:
niche_labels = cond_concat_new.uns['niche_label_summary'].copy()
ct_labels = sorted(cond_concat_new.obs['ClusterName'].unique())
matrix_df = pd.DataFrame(
data=cond_concat_new.uns['niche_dist'].toarray(),
index=niche_labels,
columns=ct_labels,
)
cn_dist_count = cond_concat_new.uns['niche_dist'].toarray() * cond_concat_new.uns['niche_cell_count'][:, np.newaxis]
cn_dist_norm = cn_dist_count / np.sum(cn_dist_count, axis=0)
matrix_df_norm = pd.DataFrame(
data=cn_dist_norm,
index=niche_labels,
columns=ct_labels,
)
ct_df['stars'] = ct_df['q-value'].apply(p2stars)
stars_df = pd.DataFrame(
'',
index=matrix_df.index,
columns=matrix_df.columns
)
for _, row in ct_df[ct_df['enrichment']].iterrows():
niche = row['niche']
ct = row['celltype']
if (niche in stars_df.index) and (ct in stars_df.columns):
stars_df.loc[niche, ct] = row['stars']
fig, axes = plt.subplots(1, 1, figsize=(18, 8))
sns_heatmap_0 = sns.heatmap(
matrix_df,
cmap='Blues',
# cbar_kws={'label': 'Cell type proportion'},
linewidths=0.5,
linecolor='gray',
# square=True,
ax=axes
)
for i, niche in enumerate(matrix_df.index):
for j, ct in enumerate(matrix_df.columns):
star = stars_df.iloc[i, j]
if star:
if matrix_df.iloc[i, j] > np.max(matrix_df.values) * 0.7:
color='white'
else:
color='black'
axes.text(j + 0.5, i + 0.6, star, ha='center', va='center', color=color, fontsize=20, fontweight='bold')
n_rows, n_cols = matrix_df.shape
axes.plot([0, n_cols], [n_rows, n_rows], color='gray', linewidth=0.5, clip_on=False)
axes.plot([n_cols, n_cols], [0, n_rows], color='gray', linewidth=0.5, clip_on=False)
axes.set_xticklabels(axes.get_xticklabels(), rotation=90, ha='center', fontsize=20)
axes.set_yticklabels(axes.get_yticklabels(), rotation=0, ha='right', fontsize=20)
axes.set_ylabel('Niche', fontsize=20)
axes.set_xlabel('Cell Type', fontsize=20)
axes.set_title('Cell Type Proportions', fontsize=20)
axes.collections[0].colorbar.ax.yaxis.label.set_size(20)
axes.collections[0].colorbar.ax.tick_params(labelsize=16)
axes.grid(False)
plt.tight_layout()
plt.show()
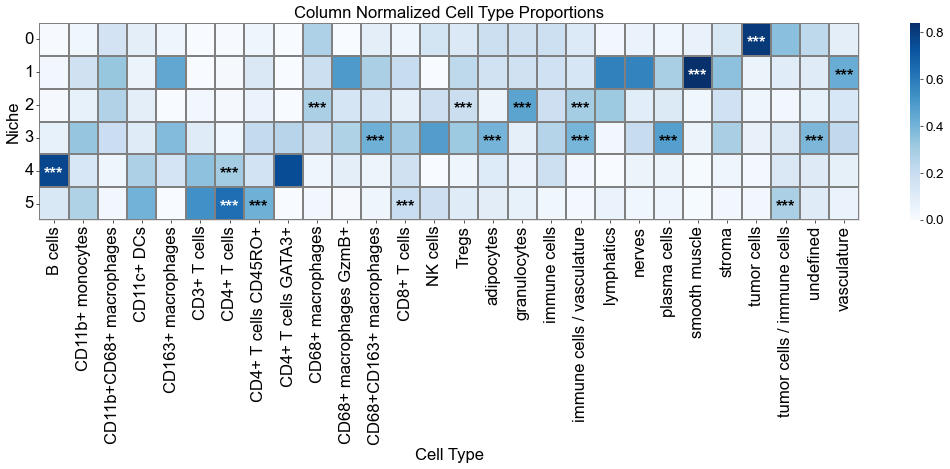
fig, axes = plt.subplots(1, 1, figsize=(18, 8))
sns_heatmap_1 = sns.heatmap(
matrix_df_norm,
cmap='Blues',
# cbar_kws={'label': 'Cell type proportion'},
linewidths=0.5,
linecolor='gray',
# square=True,
ax=axes
)
for i, niche in enumerate(matrix_df.index):
for j, ct in enumerate(matrix_df.columns):
star = stars_df.iloc[i, j]
if star:
if matrix_df_norm.iloc[i, j] > np.max(matrix_df_norm.values) * 0.7:
color='white'
else:
color='black'
axes.text(j + 0.5, i + 0.6, star, ha='center', va='center', color=color, fontsize=20, fontweight='bold')
n_rows, n_cols = matrix_df.shape
axes.plot([0, n_cols], [n_rows, n_rows], color='gray', linewidth=0.5, clip_on=False)
axes.plot([n_cols, n_cols], [0, n_rows], color='gray', linewidth=0.5, clip_on=False)
axes.set_xticklabels(axes.get_xticklabels(), rotation=90, ha='center', fontsize=20)
axes.set_yticklabels(axes.get_yticklabels(), rotation=0, ha='right', fontsize=20)
axes.set_ylabel('Niche', fontsize=20)
axes.set_xlabel('Cell Type', fontsize=20)
axes.set_title('Column Normalized Cell Type Proportions', fontsize=20)
axes.collections[0].colorbar.ax.yaxis.label.set_size(20)
axes.collections[0].colorbar.ax.tick_params(labelsize=16)
axes.grid(False)
plt.tight_layout()
plt.show()
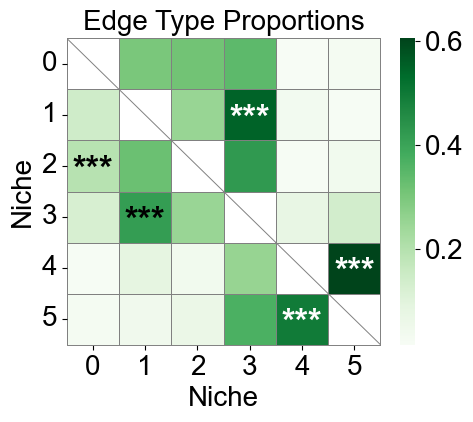
Niche-niche co-localization analysis
[86]:
nnc_results = nnc_enrichment_test(cond_list,
'niche_label',
niche_summary=cond_concat_new.uns['niche_label_summary'],
spatial_key='spatial',
cut_percentage=99,
method='fisher',
alpha=0.05,
fdr_method='fdr_by',
log2fc_threshold=1,
prop_threshold=0.01,
verbose=True,
)
nnc_df, edge_prop_mtx, n1_count = nnc_results
nnc_df.head()
6 niches in total.
[86]:
| niche1_idx | niche1 | niche2_idx | niche2 | edge_count | edge_prop | oddsratio | p-value | q-value | log2fc | enrichment | |
|---|---|---|---|---|---|---|---|---|---|---|---|
| 0 | 0 | 0 | 1 | 1 | 1837.0 | 0.299967 | 1.569305 | 5.956547e-49 | 2.974541e-48 | 0.483913 | False |
| 1 | 0 | 0 | 2 | 2 | 1923.0 | 0.314010 | 2.442555 | 4.671407e-177 | 4.665553e-176 | 0.992462 | False |
| 2 | 0 | 0 | 3 | 3 | 2111.0 | 0.344709 | 1.282265 | 8.390329e-18 | 3.591349e-17 | 0.244846 | False |
| 3 | 0 | 0 | 4 | 4 | 89.0 | 0.014533 | 0.135536 | 1.211348e-148 | 8.065530e-148 | -2.755367 | False |
| 4 | 0 | 0 | 5 | 5 | 164.0 | 0.026780 | 0.204437 | 1.105217e-140 | 6.622989e-140 | -2.147253 | False |
[87]:
niche_labels = cond_concat_new.uns['niche_label_summary'].copy()
nnc_df['stars'] = nnc_df['q-value'].apply(p2stars)
matrix_df = pd.DataFrame(
data=edge_prop_mtx,
index=niche_labels,
columns=niche_labels,
)
for i in range(matrix_df.shape[0]):
for j in range(matrix_df.shape[1]):
if i == j:
matrix_df.iloc[i, j] = np.nan
stars_df = pd.DataFrame(
'',
index=matrix_df.index,
columns=matrix_df.columns
)
for _, row in nnc_df[nnc_df['enrichment']].iterrows():
n1 = row['niche1']
n2 = row['niche2']
if (n1 in stars_df.index) and (n2 in stars_df.columns):
stars_df.loc[n1, n2] = row['stars']
plt.figure(figsize=(5, 4.5))
ax = sns.heatmap(
matrix_df,
cmap='Greens',
# cbar_kws={'label': 'Edge type proportion'},
linewidths=0.7,
linecolor='gray',
# square=True,
)
for i, n1 in enumerate(matrix_df.index):
for j, n2 in enumerate(matrix_df.columns):
if i == j:
ax.plot([i, i+1], [i, i+1], color='gray', linewidth=0.7)
# ax.plot([i+1, i], [i, i+1], color='gray', linewidth=0.7)
continue
star = stars_df.iloc[i, j]
if star:
if matrix_df.iloc[i, j] > np.nanmax(matrix_df.values) * 0.7:
color='white'
else:
color='black'
ax.text(j + 0.5, i + 0.6, star, ha='center', va='center', color=color, fontsize=25, fontweight='bold')
n_rows, n_cols = matrix_df.shape
ax.plot([0, n_cols], [n_rows, n_rows], color='gray', linewidth=0.7, clip_on=False)
ax.plot([n_cols, n_cols], [0, n_rows], color='gray', linewidth=0.7, clip_on=False)
ax.set_xticklabels(ax.get_xticklabels(), rotation=0, ha='center', fontsize=20)
ax.set_yticklabels(ax.get_yticklabels(), rotation=0, ha='right', fontsize=20)
ax.set_ylabel('Niche', fontsize=20)
ax.set_xlabel('Niche', fontsize=20)
ax.set_title('Edge Type Proportions', fontsize=20)
ax.collections[0].colorbar.ax.yaxis.label.set_size(20)
ax.collections[0].colorbar.ax.tick_params(labelsize=20)
ax.grid(False)
plt.tight_layout()
plt.show()